EA Overview
| Martingale | No |
|---|---|
| Grid | Yes |
| Scalping | No |
| Trading Pairs | XAUUSD |
| Timeframes | 4H |
| Developer | Thi Ngoc Tram Le |

Forward Test Analysis (as of December 2025)
MQL5 Signal Page(ABS GoldGrid HighRisk Small System)A “too perfect” 10x equity curve in 11 weeks
ABS GoldGrid publishes its forward test via the official signal “ABS GoldGrid HighRisk Small System.”
As of December 2025, a $100 starting account has grown to around $2,300 in equity, despite several withdrawals,
and the equity curve alone looks beautifully parabolic to the upside.
The number of trades is still just under 100, but with a win rate of around 95% and a double-digit profit factor,
at first glance it may look like a “dream EA” that multiplies your capital several times over in a short period.

The numbers look great only because it’s “just a grid & averaging EA”
In reality, this EA is a typical grid + averaging (martingale-style) gold EA.
To drastically reduce the frequency of losing trades, it keeps averaging into losing positions,
holding large floating losses and closing the basket only when price eventually comes back.
That is why the early part of the forward test shows abnormally high win rate and PF.
In fact, the statistics show that profits from winning trades accumulate in small increments, while the few losing trades are very large,
meaning the strategy always carries the pattern of “small steady wins, occasional huge loss.”
Maximum equity drawdown above 65% – a real risk of a one-shot wipeout
On the forward page, the balance drawdown looks modest at first glance, but the maximum drawdown of equity
(actual account value including floating losses) has reached over 65%, a very dangerous level.
This means the account has “survived only because positions happened to be closed in time,” and that
if market conditions had been slightly different, or if you had been greedy with lot size or deposit,
a single bad market phase could have wiped out the account in one blow.
Short-term upward forward curves are actually “to be expected”
For grid & averaging EAs, there are usually almost no losing trades in the early part of a test,
so if you only look at a few weeks or a few months, almost any such EA will produce a similar upward curve.
Therefore, you absolutely cannot conclude that an EA is safe just because it has an upward curve over an 11-week forward test.
With this type of EA, it is far more important to check in long-term backtests
how far it can withstand a major market collapse and
how often the account would blow up in the worst-case scenarios.
What the current forward test does and does not tell us
- What it does tell us: When the grid & averaging design works well, it has the explosive power to multiply the account in a short time.
- What it does tell us: Behind that, it takes extremely high risk, accepting equity drawdowns of more than half the account value.
- What it does not tell us: How often this strategy will blow up during sharp crashes or prolonged trend reversals.
- What it does not tell us: Whether it can actually stay profitable over multi-year periods.
In short, if we look only at the forward test as of December 2025, we can say that it is “extremely powerful in the short term,
but with an equally extreme risk of account destruction.” In the next section, we will dig into the long-term backtest
to see how realistic that risk actually is.
Backtest Analysis (2005–2025)
Backtest conditions over roughly 20 years of data
Because the forward performance alone does not show the true risk of this EA, I ran my own backtest.
The conditions were as follows (tests performed as of December 2025):
- Period: 1 January 2005 – 28 November 2025 (about 20 years)
- Symbol: XAUUSD
- Initial deposit: $10,000
- Lot size: fixed 0.01 lot
- Other parameters: all default settings
- Spread: 30 points

 Backtest report of ABS GoldGrid. There were 3,985 total trades and a profit factor of 2.17, but the maximum equity drawdown was about $5,500, which is extremely large for 0.01-lot trading.[/caption]
An overall upward curve with about $5,300 total profit
Looking purely at the result, the equity curve is roughly upward sloping, and with a $10,000 starting balance,
the final net profit was about $5,385.
With 3,985 trades, the sample size is more than sufficient, and a profit factor of 2.17 and a win rate in the high 70s
make it look, at first glance, like an EA that “steadily builds profit.”
However, a closer look at the graph reveals several deep drawdown valleys.
While the balance line rises gently, the equity line (actual account value including floating losses)
dives sharply at certain points. This is the classic behavior of grid & averaging EAs that “hold and endure floating losses.”
A maximum equity drawdown of about $5,500 despite using only 0.01 lots
The most important metric in this backtest is the absolute value of equity drawdown.
Even though we used the minimum lot size of 0.01,
the maximum equity drawdown recorded during the backtest reached about $5,500.
In other words, at one point, nearly half of the $10,000 account was temporarily wiped out.
The maximum losing streak was 49 trades, with a total loss of about $1,550 during that run.
If we imagine increasing the lot size to 0.05 or 0.1,
the same market pattern would produce tens of thousands of dollars in drawdowns.
In other words, this EA:
- Is designed so that even at the minimum lot size, it can generate several-thousand-dollar equity drawdowns.
- Will scale those drawdowns almost proportionally if you increase the lot size.
- Operates not in a world where “more capital means safety,” but in a world where everything depends on “how much floating loss you are prepared to endure.”
This confirms that the EA has a very aggressive and dangerous risk structure.
Backtest shows how the EA is “just lucky to have survived”
Over the roughly 20-year backtest, the system ended in profit,
but along the way it experienced multiple episodes where the account could easily have lost the majority of its equity.
It finished in the black only because the market eventually reversed in its favor.
If the same-scale trends had extended just a bit further,
or if spread and execution conditions had been slightly worse,
it is fair to say that the EA could have blown up quite easily.
It is especially important to note that these tests used a very conservative setup of
“0.01 lot + $10,000”.
In real trading, if you increase the lot size because you “want to grow faster,”
the several-thousand-dollar equity drawdowns in the backtest will scale up into tens of thousands of dollars.
From this, we can conclude that although the EA is profitable in long-term backtests,
it has a design where even a small mistake in lot sizing can blow up the account in one shot.
In the next section, we will dig deeper into the grid & averaging trading logic
and risk characteristics that produce this behavior.
Trading Logic and Risk Characteristics
A classic grid EA – with very tight spacing
As the developer openly states that this is a “gold-only EA using grid + martingale strategy,”
ABS GoldGrid is indeed a typical grid-style averaging EA.
Looking at the trade history on the chart, you can see long positions being added one after another during price declines,
and then closed together once price has recovered to some extent.
The spacing between each entry (the grid width) is very tight,
so positions build up quickly even within relatively small price swings.

“Averaging down” behavior seen on the M1 chart
When plotting the forward trade history on the M1 chart,
we can see almost identical lot-size buy orders added step by step during short-term declines.
Every time price drops, a new buy position is opened, and when it rebounds, multiple positions are closed together –
a textbook example of a grid & averaging EA.
During this process, floating losses temporarily balloon, but if the market recovers,
they are wiped out quickly, making the trade history look like a series of small wins and
a smooth equity curve – a typical hallmark of this style of EA.
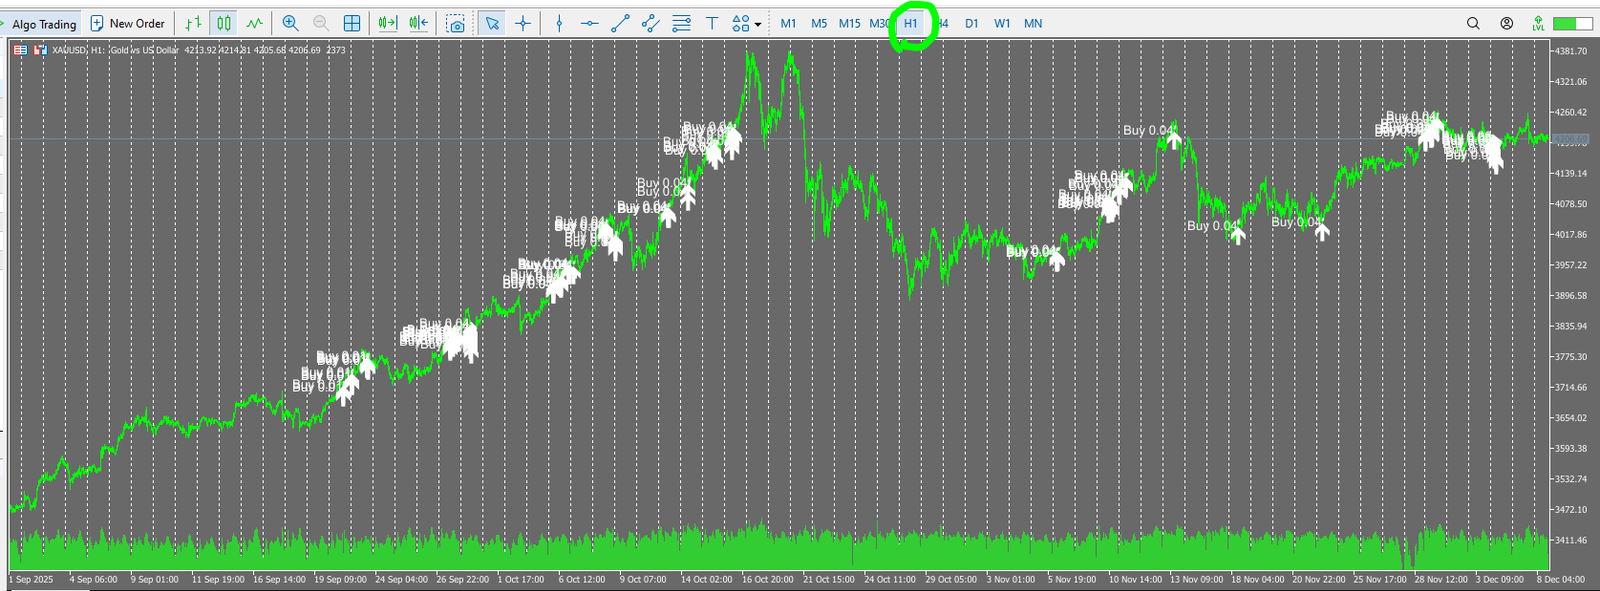
Trend-following longs on the H1 chart
On the H1 chart, you can see frequent long entries along the uptrend.
The EA buys on dips, pyramids into pullbacks, and closes baskets after price moves back up,
creating a profit pattern that combines trend following with grid logic.
However, when gold suffers a major sell-off,
the EA keeps averaging down against the move, continuously buying into a falling market,
which means both floating losses and position count can explode very quickly.
Developer’s stated concept: aggressive scalping and cycle-based trading
Summarising the developer’s description, the EA is built around the following concept:
- It is explicitly designed as an aggressive scalping bot for gold.
- It aims for high short-term returns using grid + martingale, and openly states that it is “not a safe system.”
- Both fixed lots and auto-lots (lot size adjusted to account balance) are available.
- Parameters such as maximum allowed drawdown are provided to keep risk within a certain range, but the core logic remains high-risk.
- The developer recommends a “cycle trading” approach: take profits of +20–25%, withdraw, reset the account, and repeat.
In other words, even the developer clearly positions this EA not as a low-risk, long-term investment tool,
but as a high-risk, short-term trading system.
Risk profile: “one-shot death” risk from a design that depends on enduring floating losses
The biggest issue with this EA is that it is designed on the assumption that it will hold and endure large floating losses.
Because the grid is so tight, positions pile up quickly when the market moves against you.
If you increase the lot size, even a relatively small move of a few tens of dollars in gold
can cause catastrophic damage to the entire account.
In the backtests, even with the minimum 0.01-lot setting,
there were several episodes where floating losses reached several thousand dollars.
The forward and backtest equity curves may look nicely upward sloping,
but underneath they are constantly running in a state where
“one more push in the wrong direction could blow up the account.”
This is the very definition of a classic grid & averaging EA.
Whether you should use this EA depends entirely on whether you can
accept this nature and treat it as a high-risk strategy for small, disposable capital,
traded in short cycles.
Overall Assessment and Conclusion
Both the forward and backtest equity curves of ABS GoldGrid look beautifully upward sloping at first glance,
but behind them lies the ever-present risk typical of grid & averaging EAs – the possibility of a total account wipeout.
Summarising the information available as of December 2025, we can evaluate it as follows:
Key takeaways from this EA
- In the forward test, the account balance has multiplied several times in a short period, showing very strong upside potential.
- The core logic is tight-grid averaging down on the buy side, which can accumulate profits efficiently when the trend continues.
- In a 20-year backtest, it ended in profit overall, but there were multiple occasions with floating losses of several thousand dollars.
- Because such deep drawdowns occur even with a minimum 0.01-lot setting, increasing the lot size will almost proportionally inflate the loss amounts.
- The developer clearly states that it is “not a safe system,” assumes high risk, and recommends cycle-based trading with frequent withdrawals.
Who this EA is and isn’t suitable for
- Suitable for:
· Traders who want to risk a small amount of disposable capital in a high-risk, short-term strategy.
· Traders who fully understand the grid & averaging risk of “eventually taking a big hit” and still want to experiment with it. - Not suitable for:
· Traders who prioritize long-term stability and capital preservation.
· Traders who cannot tolerate account blowup risk or who struggle mentally with large floating losses.
· Beginners who want a “set-and-forget” EA to manage their funds safely.
Final verdict
ABS GoldGrid can generate large profits in a short time when conditions line up,
but depending on how the market moves, a single drawdown phase can almost completely destroy the account.
It is dangerous to assume safety just because both the backtest and forward test show upward curves;
the only realistic way to view it is as a high-risk, gambling-style EA.
Personally, I would not entrust it with significant capital.
At best, it is an EA you might consider testing with a small amount of “play money,”
and only after fully understanding the risks involved.
This is a classic grid + martingale EA with a very tight grid, designed as a high-risk system. Even with a fixed 0.01 lot, the maximum equity drawdown reached about $5,500. If you increase the lot size, a single adverse move can easily wipe out the entire account. It is a clearly dangerous EA, built on the assumption that you will “take a big hit someday.”