EA Overview
| Logic Overview | Trend-following / Breakout |
|---|---|
| Martingale | No |
| Grid | No |
| Scalping | No |
| Timeframes | 1H |

Forward Test Analysis
Forward Performance on MQL5 and Myfxbook (as of November 2025)
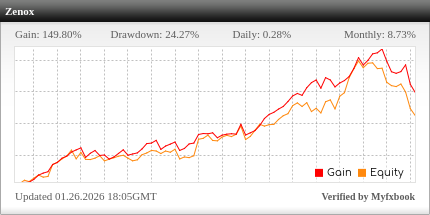
Zenox EA is one of the few EAs that publishes real-account forward performance both as an official MQL5 signal and on Myfxbook. Compared with EAs that only show backtest screenshots, this level of performance disclosure is a clear plus in terms of transparency. However, the figures discussed here are only a snapshot of the current situation (around 100 trades so far) and do not guarantee future performance.
High Win Rate but Modest Expectancy per Trade
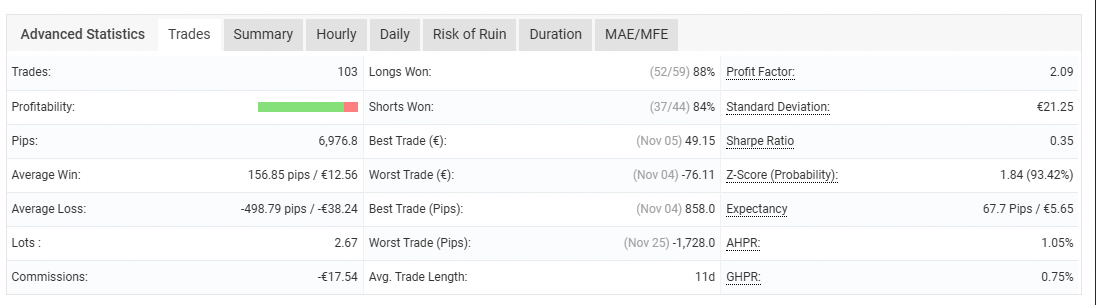
Zenox EA real-account forward test (Myfxbook Advanced Statistics). With around 100 trades, it shows a high win rate and a profit factor of 2.09, while the average loss is larger than the average profit, resulting in a typical high–win-rate, low–risk-reward profile.
In Myfxbook’s Advanced Statistics, there are 103 trades with a profit factor of 2.09, which is a solid figure. Long trades show 52 wins and 7 losses (88% win rate), while short trades show 37 wins and 7 losses (84% win rate), so both sides maintain very high win rates. The expectancy per trade is about +67.7 pips / +€5.65, which means that statistically the account is “gaining a little bit with each trade” over time.
Relationship Between Risk–Reward and Hedging Structure
On the other hand, the average profit is +156.85 pips (+€12.56), while the average loss is −498.79 pips (−€38.24), so if you only look at the raw numbers, the risk–reward ratio appears quite poor. The best trade is +858 pips, whereas the worst is −1,728 pips, and stop-losses tend to be triggered relatively late, so the damage when a loss finally hits is not small.
However, when you look more closely at the backtests and chart behavior, you can see that Zenox EA often manages positions by combining hedging trades (holding long and short at the same time). Because of this, the “numerical loss on a single losing trade” does not translate one-to-one into a sudden collapse of the entire account. In practice, the way profits and losses are realized is not as extreme as the simple risk–reward numbers might suggest.
Trading Style and Drawdown
The average holding time is about 11 days, so this is not a typical scalping or day-trading EA; it operates more like a swing trading system, holding positions for several days to a few weeks. Because of this style and the hedging structure, floating losses can become sizable at times, and maximum drawdown (especially equity drawdown) can be moderately deep. The equity curve itself, however, tends to look like “steady upward compounding with occasional larger corrections,” which is typical of high–win-rate systems.
Current Assessment and Points to Note
Overall, with forward performance disclosed on both MQL5 and Myfxbook, Zenox EA can currently be evaluated as a strategy with positive expectancy. In real trading, though, it is not advisable to simply copy the relatively aggressive risk settings used in the official signal. A more realistic approach is to lower lot size and risk percentage to match your own acceptable drawdown level, and then decide how to interpret this forward performance. The trading logic and risk characteristics are examined in more detail in the following section.
Backtest Analysis
Backtest Conditions Used for Verification
To go beyond the developer’s published information and check the actual behavior of the EA, I ran my own backtests in MT5 under the following conditions:
- Period: January 1, 2005 – November 28, 2025 (about 20 years of data)
- Symbols: XAUUSD (Gold), GBPUSD, GBPAUD, GBPJPY, EURUSD, EURGBP, EURJPY, AUDUSD, AUDCHF, AUDNZD, NZDUSD, NZDCAD, NZDJPY, USDCAD, USDCHF, USDJPY, all traded simultaneously in a single backtest
- Lot size: all positions fixed at 0.01 lots
- EA parameters: all default settings
- Spread: broker’s variable spread
- Account currency: USD
The history quality is shown as 99%, with a sufficient number of ticks, so the test environment is reasonably reliable.
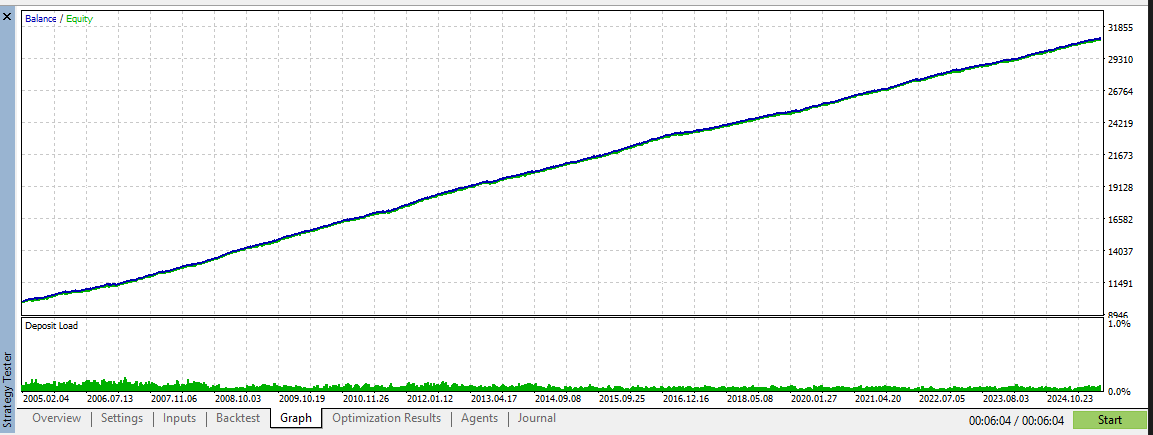
Backtest result of Zenox EA with 0.01 fixed lots over about 20 years. There are almost no large swings or sharp crashes, and the curve remains smoothly upward over the long term.
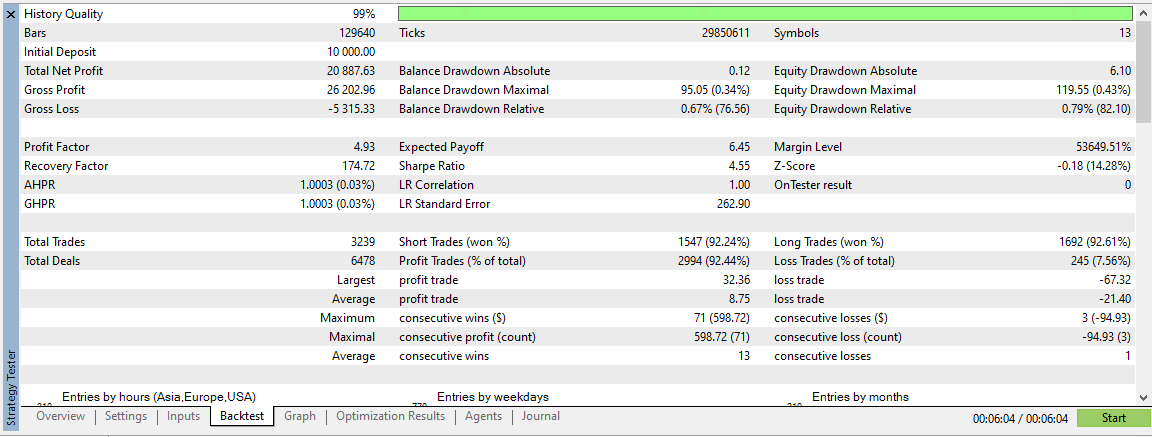
Detailed 20-year backtest report for Zenox EA (0.01 lots). Despite a high profit factor and win rate, the absolute equity drawdown is kept around 120.
Nearly 20 Years of an Almost Straight Up Equity Curve
Looking at the graph, both balance and equity rise very smoothly from 2005 to 2025, almost in a straight line. There are hardly any sharp drops or big steps, and the EA appears to maintain relatively consistent performance over the long term.
The developer states that the AI was trained on high-quality data from 2000–2020 and that 2020 onward is treated as an out-of-sample period. In this backtest as well, there is no sign of a blow-up over the full period, and at least under this test environment, the logic does not appear to break down in any particular market phase.
Absolute Drawdown for Fixed 0.01 Lots
Here, instead of looking at drawdown as a percentage of balance, I focus on the absolute monetary drawdown for fixed 0.01 lots as the key risk measure. In this backtest, the maximum equity drawdown was limited to about 119.55 (in account currency units).
With an initial deposit of 10,000 and a constant 0.01 lot size, keeping drawdown to this level is quite impressive. Even for a high–win-rate EA, given the tendency to hold positions and use hedging, you might expect larger absolute swings. From this perspective, the “absolute risk per 0.01 lot” is very well controlled.
Profit Level and Expectancy
On the profit side, despite operating with fixed 0.01 lots and an initial balance of 10,000, the backtest achieved a total net profit of 20,887.63, which is a very large gain. There were 3,239 trades in total, with a profit factor of 4.93 and win rates above 92% for both long and short trades, clearly reflecting the high–win-rate, high-expectancy profile claimed by the developer.
The expected payoff per trade is 6.45, which is more than adequate for a 0.01-lot system. Of course, no backtest can be assumed to carry over perfectly to live trading, but the combination of “this level of net profit and profit factor with only ~120 units of maximum equity drawdown” is extremely strong by backtest standards.
Interpreting the Backtest and Caveats
In summary, this verification backtest over nearly 20 years and multiple currency pairs shows an extremely clean equity curve and very attractive profitability. However, it is still just one set of results for a specific broker’s historical data and fixed 0.01-lot settings. In live trading, spreads, execution, slippage, and lot size changes will all affect the actual risk–return profile.
Because Zenox EA combines hedging and longer holding times, floating drawdowns can become quite large at times. Even though the backtest shows a small absolute maximum drawdown, if you scale up lot sizes in real trading, you must think in terms of: “If this is the drawdown at 0.01 lots, what does that imply for my own planned lot size?”
Even so, the fact that the EA manages to combine such a smooth, long-term equity curve with relatively small absolute drawdowns over nearly two decades is a major strength in terms of backtest results.
Trading Logic and Risk Characteristics
Trend-Following Breakout Entries
Looking at the trade history charts (white arrows for buys, red arrows for sells), Zenox EA appears to enter mainly when clear ranges break or when swing highs and lows are taken out. Rather than classic pullback entries, it waits for price to move in the direction of the trend and then enters around the breakout of recent highs or lows. In other words, it is a breakout-oriented trend-following style, aiming to capture larger swings while ignoring small short-term noise.
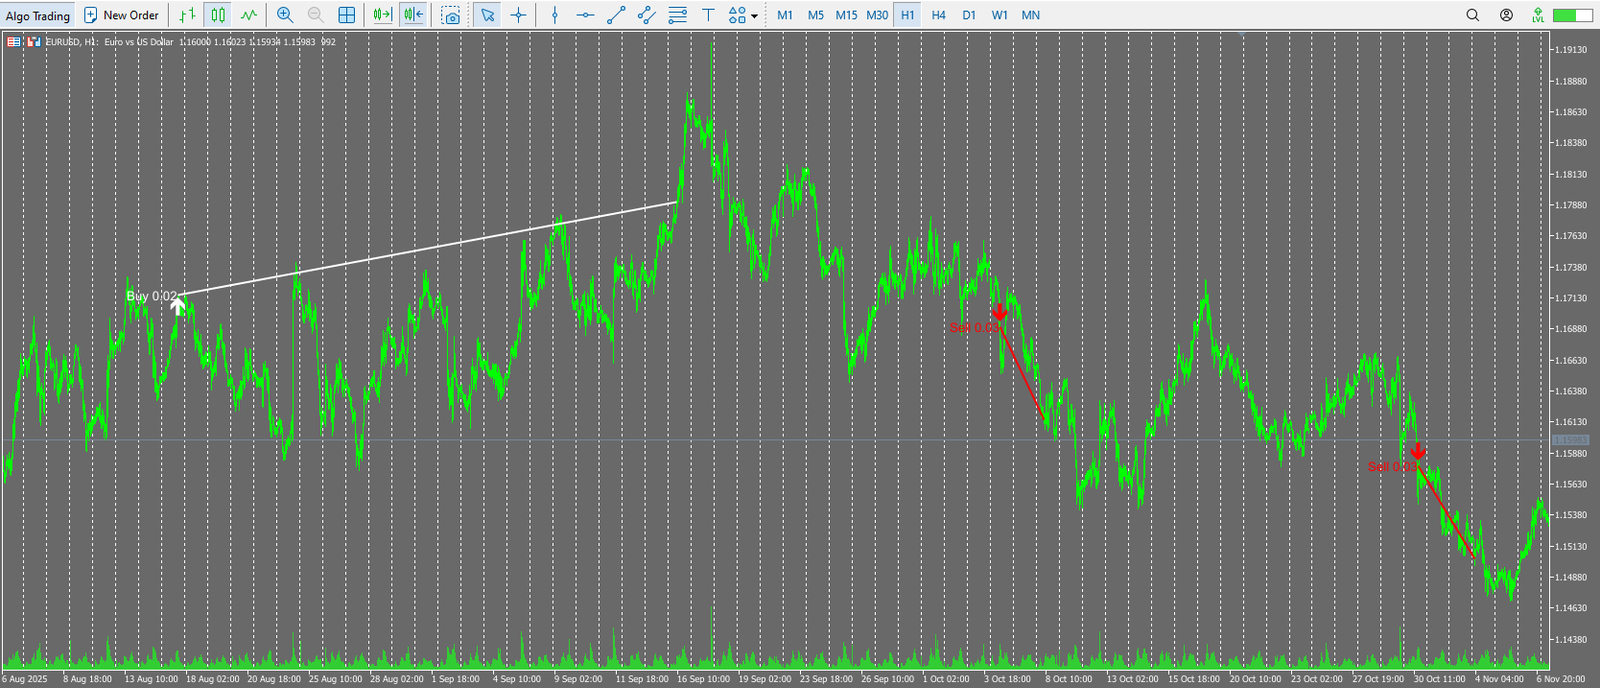
Forward trade history of Zenox EA. Entries are taken on breakout moves in the trend direction, with buys shown in white and sells shown in red.
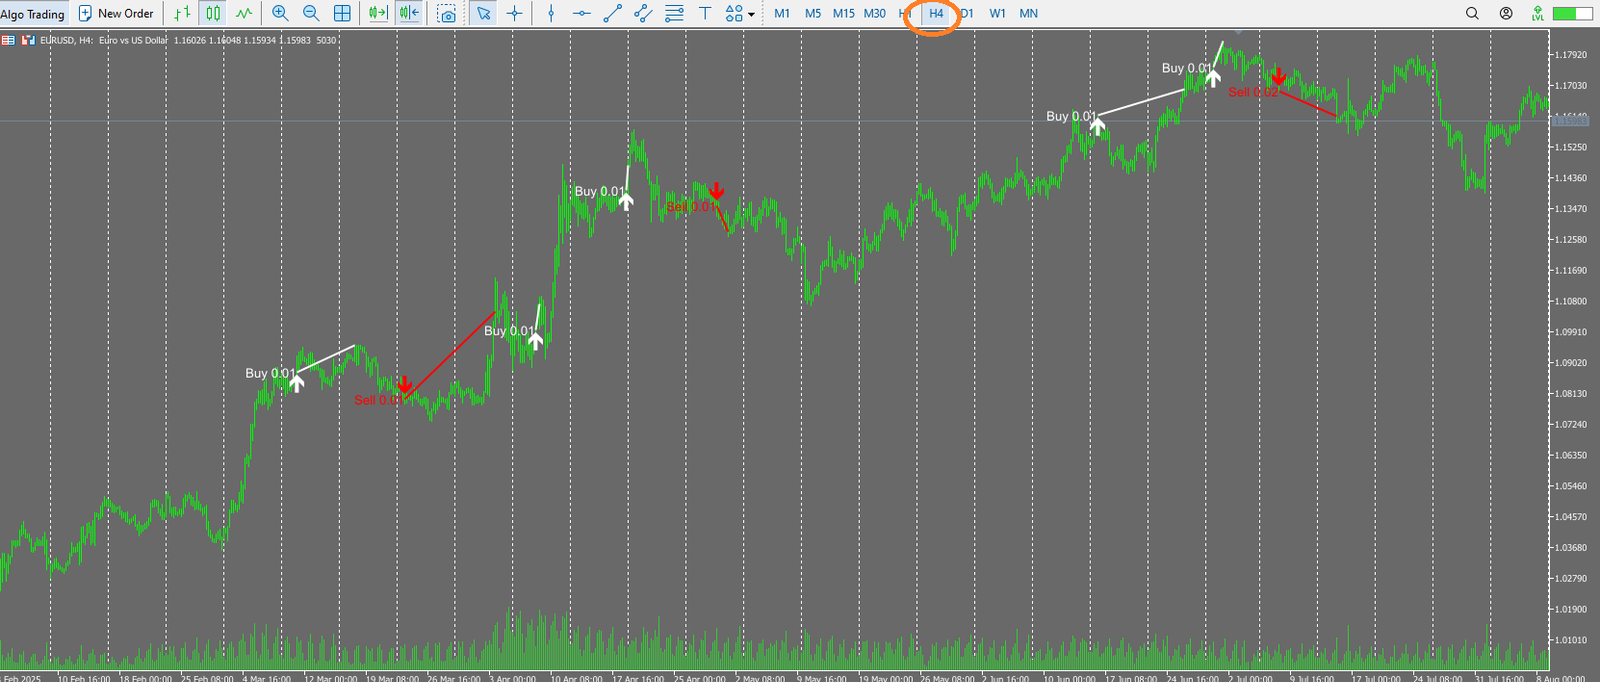
Forward trade history of Zenox EA plotted on EURUSD H4. Most entries are aligned with the higher-timeframe trend, aiming to capture swing-size moves.
Positioning with Higher-Timeframe Trend in Mind
When trade history is plotted on both H1 and H4, many entries appear to be aligned with the broader directional move on each timeframe. According to the developer, the AI was trained on high-quality historical data from 2000–2020 and then further optimized with reinforcement learning. In this process, the system likely learned the structure of higher-timeframe trends and volatility, and uses that to determine the current trend direction before entering on breakout points.
In strong trending phases, white arrows (buys) and red arrows (sells) tend to appear in the direction of the main move, with very little counter-trend trading. In that sense, Zenox EA can be described as a system that generally respects the larger trend and seeks to follow it.
16 Pairs Traded Simultaneously, but Low Frequency per Pair
Zenox EA is designed as a multi-currency EA that trades 16 symbols including XAUUSD from a single chart. However, in both forward and backtest trade histories, the number of entries per individual pair is not very high. Because entries are only taken when trend-following conditions are met, trade frequency is relatively low, suggesting a design that prioritizes expectancy per trade rather than trade count.
As a result, while the total number of trades across all symbols is reasonable, it is not the type of EA that repeatedly trades the same pair over and over. Instead, it spreads opportunities across multiple pairs, picking only those setups that meet its criteria, in a portfolio-style approach.
Numerically Poor Risk–Reward, but Hedging Softens the Real Risk
In both forward and backtest statistics, the average loss is larger than the average profit, so the simple risk–reward ratio (average profit ÷ average loss) is not attractive. In practice, one losing trade can offset several winners, which is typical for a high–win-rate, low–risk-reward profile.
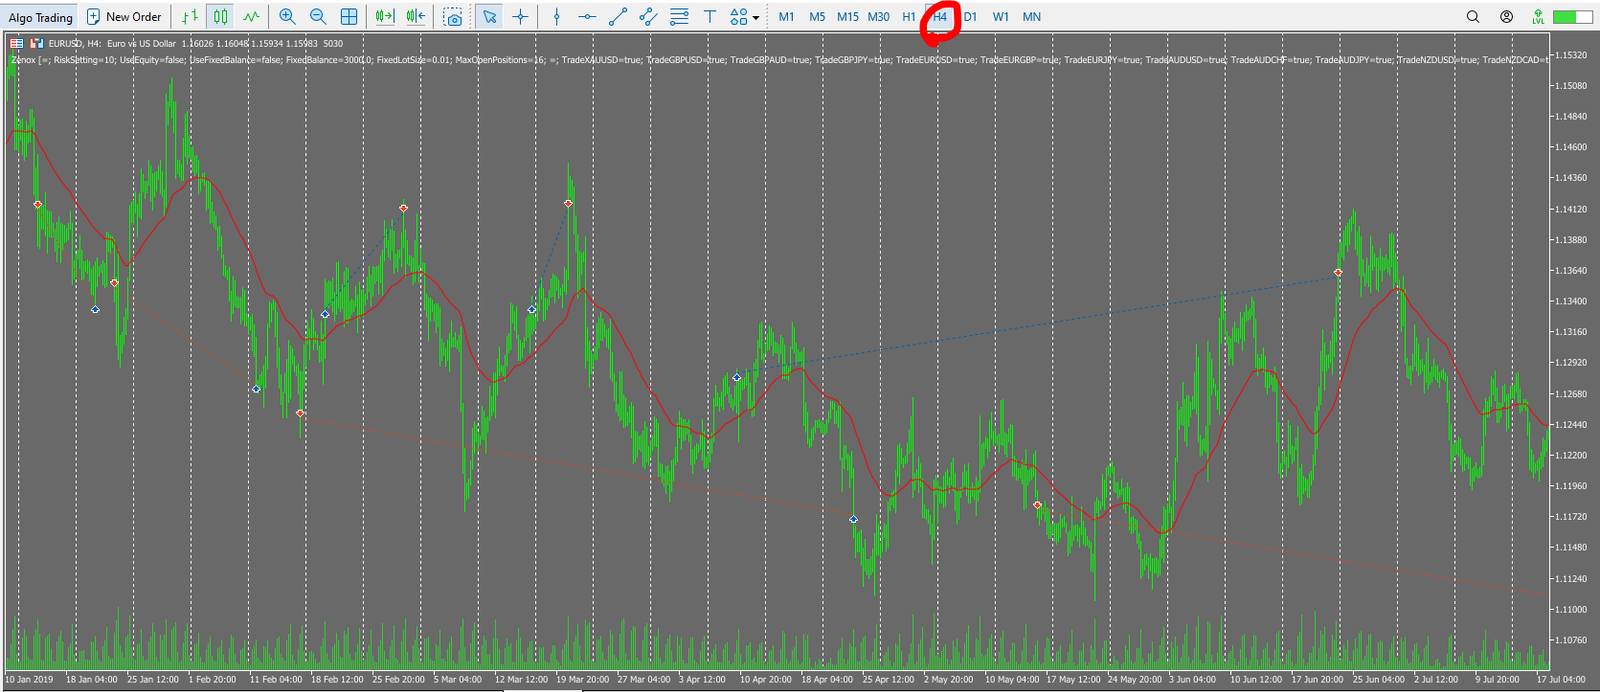
Backtest trade history from my own test. During adverse moves, the EA continues to hold existing positions while adding opposite-direction trades, forming hedges that help avoid extreme equity drawdowns.
However, as the trade history chart above (from my backtest) shows, Zenox EA doesn’t simply hold losing positions in one direction indefinitely. In many cases it adds opposite-direction trades to build a hedge. For example, it may hold a long position for a long time, then add short positions when the market reverses, effectively offsetting some floating losses with floating gains.
Because of this hedging structure, while individual trades may show large stop-loss distances, the equity drawdown at the account level is not as extreme as the raw risk–reward statistics would suggest. In strong adverse trends, the EA tends to gradually rebalance the position mix instead of remaining fully exposed in a single direction, which helps to suppress equity drawdowns.
Summary of Risk Characteristics
- Trend-following, breakout-style entries that build positions in line with higher-timeframe moves.
- Trades 16 pairs simultaneously, but with relatively low frequency per pair and a strong bias toward selective entries.
- Although the statistical risk–reward ratio is poor, the use of hedging positions helps keep equity drawdowns more controlled than the raw numbers suggest.
- Because positions are often held for long periods through adverse moves, the ability to tolerate floating losses and time-based stress is a key requirement for anyone running this EA.
In short, Zenox EA looks like a high–win-rate, low–risk-reward system if you only focus on the numbers, but the actual position management is more complex and heavily reliant on hedging. As a result, you cannot fully assess its risk profile just by looking at “stop-loss size per position”; you need to consider the overall equity behavior and hedging behavior.
Overall Assessment and Summary
Zenox EA is an AI and reinforcement-learning based multi-currency EA that scores highly in terms of transparency and long-term stability: it publishes forward results on both MQL5 and Myfxbook, and my own 20-year, 16-pair backtest shows a smooth upward equity curve without collapse. On the other hand, the recommended risk settings are quite aggressive, the system is structurally high–win-rate but low–risk-reward with long floating drawdowns, and the purchase price is very high. Running this EA realistically requires a decent risk tolerance and experience.
Strengths
- Real-account forward performance is published on both MQL5 and Myfxbook, offering high transparency.
- My own verification shows a very smooth, upward equity curve in a 20-year backtest with fixed 0.01 lots.
- No martingale or grid; every trade has an SL/TP, which is positive for robustness.
- Portfolio trading across 16 pairs reduces dependency on any single currency pair.
- Hedging positions help prevent equity drawdowns from becoming as extreme as the raw risk–reward figures might imply.
Risks and Points of Caution
- The MQL5 description assumes a relatively high risk per trade (around 5–7.5%), and copying this as-is can lead to very large account swings.
- Even with hedging, this remains a “high–win-rate, low–risk-reward” strategy with large average losses; occasional big stop-losses can have a noticeable impact on the equity curve.
- Because of hedging and long holding times, floating losses can persist for long periods, requiring strong psychological resilience.
- The forward sample is still only around 100 trades, which is not yet sufficient for a statistically robust long-term conclusion.
- The official price is very high (around USD 1,300–3,000), so whether you can realistically recoup the cost depends heavily on your risk percentage and trading horizon.
Conclusion
Zenox EA is a very attractive EA in terms of forward transparency and backtest stability, and its hedging-based trade management helps avoid excessive risk. It will be interesting to see how the forward results evolve over the coming years. However, given the high price and the system’s structural characteristics, it is not a “one-size-fits-all” EA for every trader. If you are considering purchasing or running it, I strongly recommend starting with much lower risk than the official settings, using demo or very small lots first, and carefully checking whether the balance between acceptable drawdown and expected return fits your own tolerance before making a final decision.
Zenox EA does not use grid or martingale, and every trade is protected by a fixed SL/TP, which is a clear positive for robustness against account blow-ups. Because it is a high–win-rate, low–risk-reward type system, each individual stop-loss tends to have a relatively large impact. However, the use of hedging positions helps to limit extreme equity crashes to some extent.