EA Overview
| Logic Overview | Trend-following |
|---|---|
| Martingale | No |
| Grid | No |
| Scalping | Yes |
| Trading Pairs | XAUUSD |
| Timeframes | 1H |
| Developer | Guilherme Jose Mattes |

Current Forward Test Analysis (MQL5 Signal)
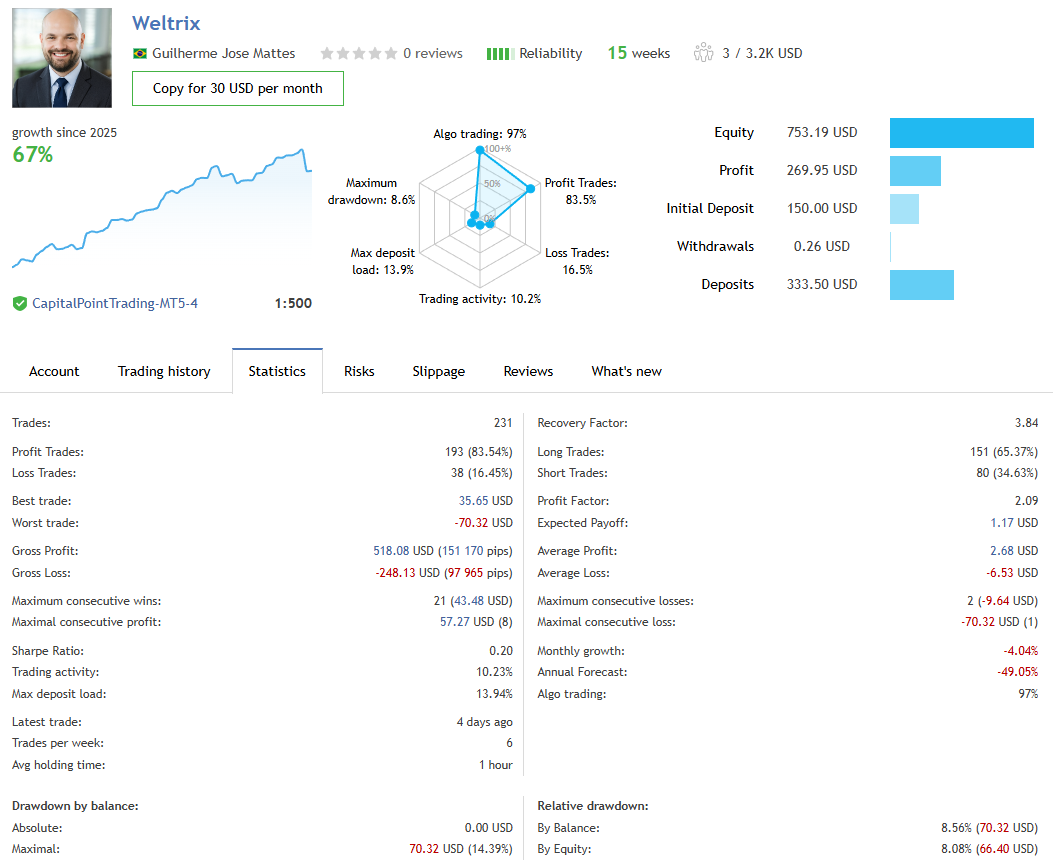
This section summarizes the forward results as of today (Dec 15, 2025), based on the attached MQL5 signal statistics.
Because forward statistics can change over time, please read this as a “snapshot” of the current situation.
Trading Environment and Track Record
- Track record: 15 weeks
- Broker shown: CapitalPointTrading-MT5-4, leverage 1:500
- Algo trading: 97%
A 15-week history is still short. How the strategy behaves when market conditions shift (sudden spikes, persistent trends, volatility expansion) needs further observation over time.
Performance Trend: High Growth, but Some Negative Monthly Results
- Growth since 2025: 67%
- Profit: 269.95 USD
- Equity: 753.19 USD
- Monthly growth: -4.04%
Overall growth is positive, but the platform also shows a negative monthly figure (-4.04%), which may indicate a recent drawdown or consolidation phase.
Rather than focusing on a short “good streak,” it is more important to watch how much it falls after rising and how quickly it can recover.
Deposits/Withdrawals: Can Distort the Visual Impression
- Initial Deposit: 150.00 USD
- Deposits: 333.50 USD
- Withdrawals: 0.26 USD
Compared with the initial deposit of 150 USD, additional deposits (333.50 USD) are relatively large.
Because deposits can change how the equity curve looks, it is safer to evaluate the forward mainly by profit, maximum drawdown, and risk-reward.
Trade Frequency and Holding Time: Moderate Frequency, Short Holds
- Total trades: 231
- Approx. trades per week: 6
- Average holding time: 1 hour
- Direction: Long 151 (65.37%) / Short 80 (34.63%)
With roughly six trades per week and an average holding time of one hour, it is not ultra-high frequency.
However, because it relies on short-term exits, spread and execution quality (slippage) can still have a meaningful impact.
Risk Metrics: Moderate Max DD, but Large Single Losses Stand Out
- Relative drawdown: By Balance 8.56% (70.32 USD) / By Equity 8.08% (66.40 USD)
- Maximum drawdown (radar): 8.6%
- Max deposit load: 13.9% (statistics show 13.94%)
- Recovery Factor: 3.84
A max drawdown around 8–9% is not “extreme” for a forward account.
That said, the worst trade is -70.32 USD, and it matches the balance-based max drawdown (70.32 USD). This suggests performance can be heavily influenced by single large losing trades.
Conclusion: Win-Rate Dependent, with Poor Risk-Reward
- Win rate: Profit Trades 83.54%
- Profit Factor: 2.09
- Expected Payoff: 1.17 USD
- Average win: 2.68 USD
- Average loss: -6.53 USD
- Worst trade: -70.32 USD (Best trade: 35.65 USD)
The key issue is that the average loss (-6.53) is far larger than the average win (2.68), which indicates poor risk-reward.
This structure tends to “stack small wins with a high win rate, then give back a lot when it loses,” meaning one big loss can erase many winning trades.
A win rate in the 83% range and PF 2.09 look good on the surface, but if risk-reward is poor, performance can collapse quickly during sudden moves or unfavorable streaks.
Going forward, the most important points to monitor are how often large losses occur and whether the strategy can recover afterward.
Current Takeaways (What to Watch Next)
- The track record is still short (15 weeks), so robustness across different market regimes is unproven
- Large additional deposits can distort the curve, so prioritize profit, drawdown, and average loss
- Because risk-reward is poor, anyone considering it should keep lot sizes small and define an acceptable loss limit in advance
Backtest Analysis (Author Verification)
This section summarizes Weltrix’s performance and reliability based on a backtest performed by me for verification (as of Dec 15, 2025).
Backtest Settings (This Test)
- Period: Jan 1, 2025 to Dec 15, 2025
- Symbol: XAUUSD
- Initial deposit: 10,000 USD
- Lot size: Fixed 0.01 lot
- Other settings: Default
- Spread: 20 points


Overall Result: Low Profitability, Clearly Poor Performance
In this backtest, the curve trends downward overall, with a notable dip followed by a stalled recovery.
There is little evidence of positive growth in the statistics, and performance remains poor across different test windows.
Profit Breakdown: Losses Exceed Gains, Negative Expectancy
- Total Net Profit: -14.75 USD
- Gross Profit: 28.27 USD
- Gross Loss: -43.02 USD
- Profit Factor: 0.66
- Expected Payoff: -0.15
Gross loss is larger than gross profit, resulting in a negative total net profit.
With a profit factor below 1.0 and a negative expected payoff, it is difficult to describe this as a “strategy that wins and grows.” Statistically, it appears more likely to lose.
Risk Assessment: Focus on Absolute Equity DD (USD), Not Percentages
Drawdown percentages depend heavily on the initial balance and lot sizing, which makes them unstable as a benchmark.
Because this test uses a fixed 0.01 lot, I evaluate risk mainly by the absolute equity drawdown (USD).
- Equity Drawdown Absolute: 21.54 USD
- Equity Drawdown Maximal: 22.59 USD
- (Reference) Balance Drawdown Absolute: 19.75 USD
- (Reference) Balance Drawdown Maximal: 20.70 USD
An equity drawdown max of about 22.59 USD is not “account-destroying” at 0.01 lot.
However, since overall performance is negative, a small drawdown here does not mean “low-risk growth.” It is better understood as low efficiency with a tendency to bleed.
Major Concern: Trade Count “Caps at 100” Even When Changing the Period
- Total Trades: 100
The most important red flag in this test is that the number of trades stays at 100 even when changing the test period.
Normally, extending the period should increase trade count. If it does not, the EA may include an intentional backtest restriction (trade-count limit).
Such a restriction prevents users from collecting enough samples to judge reproducibility and risk behavior.
This reduces transparency and undermines trust, making it a significant negative factor in the overall evaluation.
Conclusion: Poor Results + Possible Test Limitation = Proceed with Caution
Under today’s test conditions (XAUUSD, fixed 0.01 lot, default settings, 20-point spread), results were clearly poor and expectancy was negative.
In addition, the trade-count cap suggests the EA may restrict user backtesting, which is difficult to ignore.
At minimum, this is not a good fit for traders who want to “validate thoroughly in backtests before buying.”
If you still consider it, first confirm whether the restriction changes based on settings, authorization, date range, or account type.
Trading Logic and Risk Characteristics
Here, I organize the developer’s explanations (i.e., what the developer claims) and summarize the risk characteristics suggested by the attached forward trade-history charts (white = Buy, red = Sell).


What the Developer Claims (Organized Summary)
- The EA targets XAUUSD and includes multiple strategies/logic modules
- It claims not to use grid or martingale techniques
- It claims to include risk controls such as loss limits and drawdown protection
However, these are developer statements. They should be judged together with user-side validation, especially reproducible backtesting.
Entry Behavior: Tends to Enter When Price Moves Sharply
From the trade-history charts, entries often appear around sudden rises or drops.
In particular, markers sometimes appear after acceleration, suggesting a short-term approach that reacts to volatility and momentum.
Exit Behavior: Takes Profits Quickly, but Stops Can Be Slow and Holds Can Become Long
While forward statistics may show relatively short average holding times, real trading can still produce phases where stop-outs are delayed and holding times extend.
This style often “builds up small gains with quick take-profits, then suffers larger damage when it finally loses.”
Risk-Reward: Likely to Become “Small Wins, Big Losses”
The biggest weakness is a structure that tends to produce small wins and bigger losses.
It may capture small profits frequently, but the losing side can become “slow-stop” and one large loss can offset many winning trades.
Reproducibility: Scalping Is Highly Sensitive to Broker Conditions
Because the EA behaves like a scalper, it is strongly affected by spread, execution speed, and slippage.
Even with the same settings, results can differ significantly by broker and account conditions, so reproducibility is limited.
Validation Issue: Difficult to Verify Properly via Backtesting
In user backtests, behavior such as a capped number of trades can make verification itself hard to complete.
Without sufficient samples, it becomes difficult to evaluate edge and risk behavior objectively, which reduces overall trust.
Bottom Line: “No Grid/Martingale” Does Not Automatically Mean “Safe”
Not using grid or martingale can be a positive point in theory.
However, in practice, the combination of scalping’s environment sensitivity and a “small wins, big losses” structure makes this more of an EA that may work only under certain conditions than a stable, broadly reliable system.
If you test it, keep lot sizes small, define a maximum acceptable loss in advance, and monitor how it behaves during losing phases.
Overall Evaluation and Summary
This review evaluates Weltrix using the forward information available as of today (Dec 15, 2025) and the backtest results performed by the author.
Because performance can change with market regimes and execution conditions, the conclusion here should be treated as a “current snapshot.”
Bottom Line (Key Points First)
- Overall verdict: Hard to recommend
- The main reasons are the poor risk-reward (“small wins, big losses”) structure and the difficulty of verification (possible backtest limitation)
- Forward numbers may look attractive, but weak risk-reward can lead to rapid breakdown during sudden moves
Positives
- The developer claims no grid / no martingale (still needs ongoing confirmation)
- Max drawdown is not extreme in the current snapshot, and it may grow when conditions fit
Negatives (Important)
- Likely to become small wins, big losses: quick take-profits but slow stops and potentially long holds
- Low reproducibility for a scalping-oriented system: spread, execution, and slippage matter
- Hard to verify via backtest: trade count appears to cap at 100, suggesting intentional restriction
- In the author’s backtest, performance was poor (negative expectancy)
Who It Fits / Who It Doesn’t
- Not suitable for: traders who want to validate by backtest first, those seeking stability, or anyone who dislikes “small wins, big losses” profiles
- If you still try it: keep lots small and fixed, define your maximum acceptable loss in advance, and start with a short observation period
Final Comment
Weltrix advertises “no grid / no martingale,” but the current data highlights poor risk-reward and difficulty of verification.
Overall, a cautious (ideally avoid) stance is reasonable at this time.
The developer claims there is no grid or martingale, but in practice the risk profile tends to be “small wins, big losses.” Stops can be slow, and positions may be held for a long time when price moves against them. The biggest weakness is that a single large loss can easily wipe out many small gains.