I found an EA with a win rate above 90%. That means it’ll win, right?

No. You can’t tell whether an EA will be profitable from win rate alone.
The higher the win rate, the easier it is to “look good” while still being dangerous—by stacking many small wins, then wiping them out with one big loss (the classic “small wins, big losses” pattern).
What matters isn’t win rate. Check average loss, maximum loss, maximum drawdown, and expectancy (whether the average profit per trade stays positive).
Conclusion: Win rate doesn’t decide whether an EA is good
When choosing an EA, the first number most people look at is the win rate. It feels reassuring to see a lot of “wins,” and marketers love it because it’s an easy, flashy metric.
But here’s the bottom line: you can’t judge an EA’s quality by win rate alone. Win rate can be made to look great depending on the EA’s profit size, loss size, and especially its stop-loss design.
For example, some EAs pile up small profits again and again to boost the win rate—then a single large loss erases weeks or months of gains. On paper, it may show “90% win rate,” but over time the equity curve tends to break down, and running it can be mentally exhausting.
In other words, the key isn’t win rate. It’s the balance between one win and one loss, and whether the strategy is built to avoid a fatal hit when losses arrive (robustness). Win rate can be a reference, but it should not be your main metric.
As you’ll see below, what you should prioritize is expectancy, risk-reward, and whether maximum loss is controlled. Stop chasing win rate, and your EA selection gets dramatically better.
Why high win-rate EAs can be the most dangerous (the “small wins, big losses” trap)
Many traders assume “high win rate = safe.” In practice, there’s a very common pattern where the higher the win rate, the higher the hidden risk. The classic example is small wins, big losses.
This means the EA racks up many small profits, but one day a single large loss wipes out most of the gains (or the account). Early in a backtest, it often looks amazing, and it’s easy to produce marketing-friendly numbers like “90% win rate” or “many winning streaks.”
Pattern 1: Quick take-profit, slow stop-loss (huge average loss)
The easiest way to make win rate look high is simple: take small profits and allow wide losses.
- Wins: small and frequent (easy to collect)
- Losses: rare, but very large (hard to recover)
This type can feel “smooth” day to day. But when price runs hard in one direction, it gets hit—hard. The higher the win rate, the easier it is to miss how destructive the losses are.
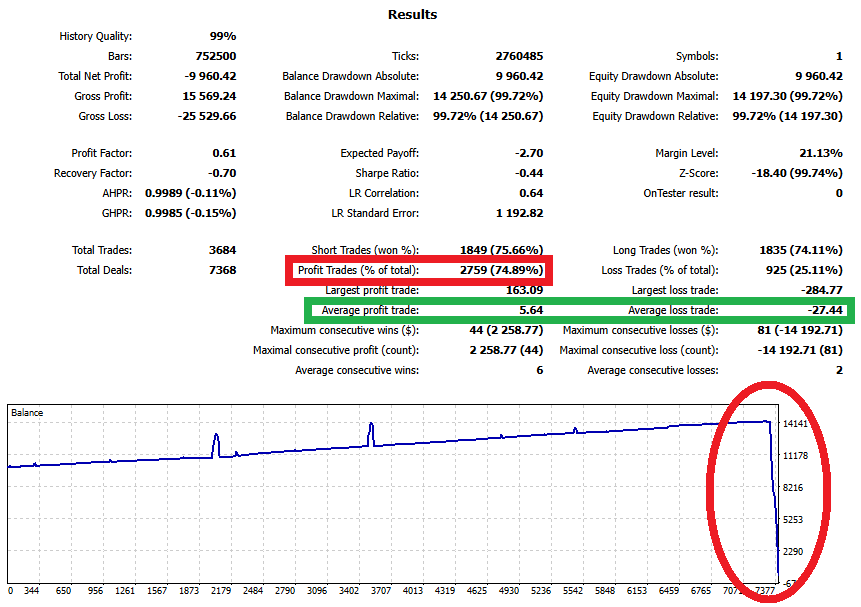
Below is a backtest example where the win rate is about 73%, yet the net profit ends up negative. In the short term it looks “strong” because winning streaks are common, but one loss is heavy, so long-term performance doesn’t hold up.
If you only look at a short backtest window—or cherry-picked periods—this can look great. Don’t get comforted by win rate or winning streaks. Always check average loss and maximum loss.

Pattern 2: No real stop-loss (boosting win rate by “waiting it out”)
If an EA shows an unusually high win rate but doesn’t clearly explain its stop-loss or maximum loss rules, be careful. Strategies that hold losing positions and wait for a comeback avoid realizing losses, so win rate stays high.
But markets don’t always come back. When they don’t, floating losses keep growing, and in the worst case the account ends with a margin call. A high win rate may not mean “safe”—it may simply mean losses are being delayed.
Pattern 3: Creating win rate with Grid / Averaging Down / Martingale
Grid, averaging down, and martingale systems often look great on win rate by design. When trades go against them, they add positions to shift the average entry price, then take profit on a small pullback. That naturally increases the number of “winning” trades.
The trade-off is obvious: when a trend keeps going, positions stack up, and the risk of a single blow-up event rises fast. In many cases, a high win rate doesn’t mean stability—it means the strategy is pushing the failure further into the future.
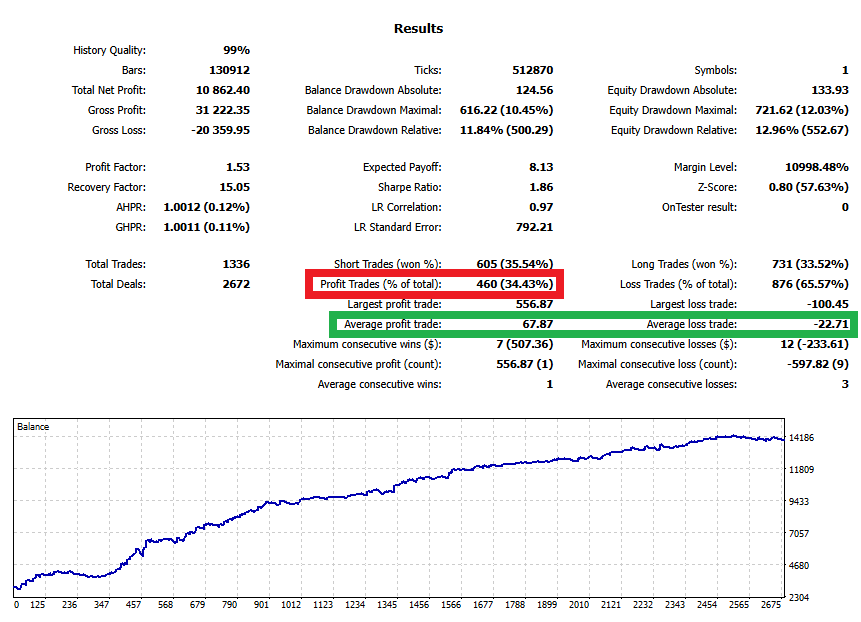
Below is a grid (averaging down) EA backtest. The win rate is around 75%, yet the account eventually blows up in one hit. Until that point, the equity curve can look “clean” with little drawdown, which is exactly why this type is so dangerous.
Related articles:
Why Grid Forex EAs Blow Up: Hidden Drawdowns + Red Flags (Self-Made EA Test)
Martingale EAs: Why They Blow Up (Backtest Proof + Checklist)
Pattern 4: Too little profit per trade (weak against trading costs)
Scalping EAs that aim for small gains are heavily affected by spread, commission, and slippage.
In backtests, costs are often underestimated and fills can look unrealistically perfect. Once you apply realistic trading costs, profits shrink, and both win rate and performance can fall apart—especially when the average profit per trade is small.
Related article: Scalping EAs: Why They Often Fail on Live Accounts (Costs, Slippage, Execution)
Pattern 5: Inflating win rate with backtest settings and presentation
Because win rate is easy to understand, it’s also easy to “shape” through presentation. Change the test window, spread settings, tick quality, or optimization approach, and win rate can move a lot.
Remember: a backtest is still based on past data. With over-optimization (overfitting), you can make an EA match historical data so well that it looks like it “never loses.” But when the market shifts even slightly, overfit EAs often break quickly.
Related article: EA Overfitting (Over-Optimization): How to Detect It Before You Buy
Summary
The higher the win rate, the more likely the “damage” is hidden. That’s why the next section focuses on what matters more than win rate: expectancy, risk-reward, and whether maximum loss is controlled.
What matters more than win rate: Expectancy and Risk-Reward
Once you stop chasing win rate, focus on expectancy and risk-reward. An EA’s performance is not determined by “how many trades won,” but by whether the average result per trade stays positive.
Expectancy is simply the average profit/loss per trade. Even with a lower win rate, an EA can grow an account if winners are larger and losers are smaller. On the other hand, even with a high win rate, an EA will eventually fail if losses are too large.
In MT5 backtest reports, a useful related metric is Expected Payoff (average P/L per trade). It’s often a more practical way to judge a strategy than win rate.
Related article: FX Trading Expectancy (EV) Explained: EAs, Win Rate, Risk-Reward & Money Management
Expectancy: the difference between what you win and what you lose
You don’t need complicated math. Two things are enough:
- Win rate (how often you win)
- Average win / Average loss (how big wins and losses are)
A lower win rate can still be profitable if wins are large. A high win rate can still lose money if losses are huge. Win rate only makes sense when you read it together with average win and average loss.
Risk-Reward: how many losses one win can cover
Risk-reward is, in simple terms, the ratio between average win and average loss.
If risk-reward is good (wins are larger, losses are smaller), an EA can grow even without a high win rate. If risk-reward is poor (small wins, large losses), then even a “high win rate” can collapse because one loss can erase dozens of wins.
Why win rate can mislead you: it’s easy to “pump up” by design
Win rate rises when an EA takes quick profits and gives trades lots of room to lose. It rises even more when the EA avoids closing losers. But that doesn’t make the EA safer—it often means risk is being hidden inside the account.
That’s why, instead of asking “Is the win rate high?”, prioritize:
- Is the average loss controlled? (no fatal damage)
- Is the average win large enough? (can recover losses)
- Is expectancy positive?
Practical checklist: what to check before win rate
- Is the balance between average win and average loss healthy?
- Is maximum loss within a realistic, acceptable range?
- Does the profit distribution look like “many small wins + occasional huge loss”?
Win rate is just a supporting metric. Next, we’ll go deeper into why EAs are won or lost by loss control design, not by win rate.
EAs are decided by loss control, not win rate
What separates strong EAs from weak ones is not the win rate—it’s the loss control design. Markets will always do the unexpected. No matter how good the logic looks, there will be losing phases. The real question is whether the EA is built so losses don’t become fatal.
It’s easy to inflate win rate. Take small profits, allow large losses, and win rate goes up. But that often creates a structure where one loss can wipe out everything. EAs that survive long-term win because they keep losses small and contained.
Point 1: Is maximum loss clearly defined? (Hard stop)
Start here: does the EA have a clear point where losses stop? Not just “it has a stop-loss,” but:
- Does it still work during fast moves?
- Are there “loopholes” where losses can expand beyond the plan?
- Can your account survive the worst-case scenario?
If the loss limit is vague, the EA is risky no matter how high the win rate is.
Point 2: Position sizing can make or break the EA
The same logic can produce completely different results depending on position sizing. Because an EA runs automatically, oversized risk can cause irreversible damage quickly.
- Fixed lot size or balance-based sizing?
- Does lot size grow too fast during volatility?
- Does the EA increase risk after losses?
Weak sizing makes an EA look good during “lucky periods,” then collapse suddenly.
Point 3: Is maximum exposure capped?
Loss control is really about limiting how dangerous the current situation can become. For EAs, these caps matter most:
- Maximum number of open positions
- Maximum total lots
- Maximum floating loss (or max allowed drawdown)
Without hard caps, positions can stack during strong trends and become unrecoverable.
Point 4: Spot weak loss control in grid/averaging/martingale behavior
Grid, averaging down, and martingale systems often show high win rates, but they fail hard when loss control is weak. Focus less on the label and more on the behavior:
- Is there a strict limit on adding positions?
- Is there a real rule to cut losses (not “wait until it comes back”)?
- Does lot size increase step-by-step—and is that growth reasonable?
If win rate is high but loss limits are not clearly explained, assume higher risk.
Point 5: Does the strategy survive costs and execution?
Loss control can fail even with “good rules” if trading conditions are harsh. With small-profit systems, spread, commission, and slippage can turn wins into losses. If a backtest wins but live trading fails, this is often why.
A practical habit: ask about the worst case, not the win rate
When reading an EA description or report, don’t make win rate the main question. Ask instead:
- Where does maximum loss stop?
- How big can floating loss get?
- What caps exist on positions and lot size?
- What is the evidence it won’t blow up during fast moves or long trends?
Win rate is only a piece of the result. Long-term survivability is decided by how the EA loses. Next, we’ll organize a practical order for reading backtests—where win rate comes last.
The right order to read a backtest (win rate comes last)
The most common backtest mistake is starting with “feel-good” numbers like win rate, total profit, or monthly return. Change the order, and you can filter out risky EAs much more reliably.
This section gives a practical checklist for reading backtests. The conclusion is simple: win rate should be the last thing you check. Start with assumptions and survivability.
Related article: How to Read MT5 Backtests: Verify EA Risk with Equity DD & Orders/Deals
Step 1: Validate the assumptions (if this is wrong, everything is meaningless)
Backtest results change easily with small setting differences. Check:
- Test period: Is it cherry-picked? Does it include range, trend, and sharp moves?
- Spread & commission: Are they realistic (account type matters)?
- Slippage: Small-profit EAs are highly sensitive (ignoring it often overstates results).
- Tick quality: Short-term EAs need high-quality data; poor data can create fake performance.
- Trading hours: Are “wins” concentrated in illiquid hours?
If conditions look too optimistic, win rate isn’t worth reading.
Step 2: Check blow-up risk (is there a fatal downside?)
EA quality is decided in bad periods, not good ones. Focus on worst-case behavior:
- Maximum drawdown (both Equity and Balance)
- Maximum floating loss (is loss being delayed?)
- Losing streak tolerance (does risk grow after losses?)
- Max open positions, max lots, and signs of stacking (grid/martingale behavior)
If you see red flags here, a high win rate won’t save the EA.
Related article: EA Drawdown (DD) Explained: How to Read MT5 Reports, Focus on Equity DD, and Set a Risk Limit
Step 3: Look at the “shape” of profits and losses
Even if total profit is positive, the structure can be fragile. Check:
- Profit distribution: Is it “many tiny wins + occasional huge loss”?
- Average win vs average loss: How many wins does one loss erase?
- Largest losing trade: Does it dominate the entire result?
If the backtest looks “profitable but unstable,” this step usually reveals why.
Step 4: Confirm expectancy and risk-reward (the core of profitability)
- Expectancy: Is average P/L per trade positive? (Expected Payoff is helpful in MT5.)
- Risk-reward: Is the win/loss balance healthy?
- Cost tolerance: Does the strategy survive realistic costs?
This matters far more than whether win rate is “high.”
Step 5: Check stability (can it survive market changes and avoid overfitting?)
- Does performance stay reasonable when you shift the test window?
- Does a small parameter change cause a huge performance collapse?
- Is profit dependent on a few lucky trades that are hard to reproduce?
Step 6: Finally, check win rate (as a consistency check)
Only after everything above looks solid should you look at win rate. The goal is not “higher is better,” but consistency:
- High win rate with huge average losses is a warning sign.
- Low win rate can be fine if expectancy stays positive.
- If win rate is high, verify that hard loss limits are clearly defined.
This order helps you escape the “high win rate = good EA” myth. Next, we’ll cover why win rate often shifts in live/forward trading and how to interpret it.
How to read win rate in forward/live trading (variation is normal)
An EA that shows a 50% win rate in a backtest might show 30% in forward testing (demo/real). That kind of change is common. If the forward period is short, win rate swings are normal.
If you judge too quickly based on short-term win rate, you might abandon a strategy with positive expectancy—basically stopping the strategy at the worst possible time.
Forward results often differ from backtests because market conditions change, execution conditions change, and the number of trades may be limited. What matters isn’t the win rate number itself, but whether you can explain the change and whether loss control works as designed.
Related article: How to Read Myfxbook: Spot Risky EAs (Balance vs Equity, Margin Spikes, Trade History)
Note 1: When market regimes change, win rate changes
EAs have “good markets” and “bad markets.” Range strategies often struggle in trends, and trend-following strategies often lose win rate in ranges.
So win rate is not only about EA skill—it’s heavily influenced by whether the current market fits the strategy. When win rate drops, first decide whether it’s simply a regime change or whether the EA’s assumptions have truly broken.
Also, an unusually high win rate isn’t always good news. It may just be a lucky stretch, or it may mean losses are being delayed and not yet visible. When win rate looks great, check average loss, maximum floating loss, and maximum drawdown together.
Note 2: Real accounts execute differently (spread / slippage / latency)
In real trading, spread, slippage, and latency directly affect results—especially for small-profit scalping EAs. Real execution is different from backtests and often different from demo accounts, so performance can get worse.
Common reasons win rate drops in real trading:
- Take-profit is missed and more trades exit at breakeven
- Fills are worse than expected, turning small wins into losses
- News spikes cause large slippage and bigger losses
When checking forward results, confirm whether it’s a real account. Don’t trust demo results too much. A drop in win rate may not mean the EA is “bad”—it may mean the strategy doesn’t survive realistic execution.
Note 3: With a small sample, win rate is mostly randomness
The fewer trades you have, the more win rate swings. Early forward results can be dominated by a few streaks.
Don’t overreact to short-term win rate. Wait until you have a reasonable number of trades before making a strong judgment.
Note 4: Don’t watch win rate—watch whether losses match the plan
In forward trading, the key isn’t win rate swings. It’s whether losses stay within expectations:
- Do losses stop where they should (hard stop works)?
- Are floating losses growing without control (loss delay)?
- Are lots/positions increasing unexpectedly (grid/martingale “runaway”)?
- Is max drawdown still within your planned tolerance?
If loss control works and expectancy remains positive, a win rate dip alone is not a reason to panic.
Note 5: Broker and account type can change win rate
The same EA can behave differently depending on broker conditions and account type: spreads, execution model, costs, and restrictions all matter.
Don’t assume your results will match someone else’s. Forward testing is about confirming whether the EA works in your environment.
What to monitor in practice (better than win rate)
- Maximum drawdown (is it getting worse than expected?)
- Average loss (are losses getting heavier?)
- Profit distribution (is it shifting toward “small wins + occasional huge loss”?)
- Signs of cost drag (small wins getting eaten by spreads/fees)
Accept that win rate varies in forward trading, and focus on whether loss control behaves exactly as designed. Next is a checklist you can use before buying or deploying an EA.
EA selection checklist that doesn’t rely on win rate (before you buy/deploy)
If you choose EAs by win rate, you’re more likely to pick something that looks great but eventually collapses. Before buying or deploying an EA, prioritize loss control and reproducibility.
1) Is maximum loss clearly defined? (If it’s vague, skip it)
- Is there a real stop-loss (or a hard loss limit rule)?
- Is it basically “wait until it comes back”?
- Does it explain where losses stop in worst cases (fast moves, long trends)?
- Is expected max drawdown shown, with a reasonable basis?
2) Will position sizing break the account?
- Fixed lots or balance-based sizing (does it grow too fast)?
- Does risk increase after losses (martingale behavior)?
- Is the real risk too large for the suggested deposit?
3) Are there hard caps on maximum exposure?
- Is there a cap on maximum open positions?
- Is there a cap on maximum total lots (or maximum risk)?
- Are the rules and limits for adding positions clearly stated?
4) Identify grid/averaging/martingale by behavior
Even if the seller avoids naming the strategy, behavior reveals it. Strong signs include:
- Positions are added in the losing direction (averaging down)
- Lot size increases step-by-step (martingale)
- Many positions close at the same time (typical grid)
- Weak explanation of maximum floating loss / relying on “it will come back”
5) Can it survive costs (spread / commission / slippage)?
- Is it a tiny take-profit style strategy?
- Are spread and commission settings realistic in the backtest?
- Does it consider slippage (especially around news)?
- Is it structurally likely to lose win rate in real trading?
6) Are backtest assumptions realistic (reproducibility starts here)?
- Is the period too short or cherry-picked?
- Is tick quality poor or settings too optimistic?
- Does it show signs of over-optimization?
- Does it disclose “uncomfortable” numbers like max DD and average loss—not only win rate?
7) Is the profit/loss shape healthy (avoid small wins, big losses)?
- Is average loss much larger than average win?
- Do a few huge losses dominate the entire result?
- Does the distribution look like “many small wins + rare massive loss”?
8) Is there a forward test?
- Is it on a real account with a credible broker?
- Is behavior similar to the backtest (avg win/avg loss pattern)?
- Is the forward period long enough to be meaningful?
9) Is the presentation honest? (Be cautious with heavy win-rate marketing)
- Does it focus only on feel-good metrics (win rate, monthly return, streaks)?
- Does it disclose max loss, max DD, and risk limits?
- Is risk explained clearly (margin call risk, fast moves, regime changes)?
This checklist shifts your focus from “high win rate” to what actually matters: survival in worst cases and performance under realistic execution.
Summary: Stop chasing win rate, and your EA trading becomes more stable
When you make win rate your top priority, it’s easy to miss the real risk. Win rate changes depending on settings, and it’s easy to use as marketing. That’s why moving away from win rate often makes your EA trading more stable.
Stability comes from reproducibility and robustness:
- Does it avoid fatal damage when the market changes?
- Does it work under real execution (spread/slippage/latency)?
- Do losses stop where the design says they stop?
Related article: EA Robustness Explained: How to Choose a Forex Trading Robot That Won’t Blow Up
The core metrics to prioritize
- Loss control design: max loss and max exposure are defined; losses don’t become fatal
- Expectancy and risk-reward: the structure stays positive even if win rate moves
- Reproducibility: assumptions are realistic, and behavior is consistent in forward/live trading
If win rate drops in forward trading, don’t panic
Win rate swings are normal. What matters is whether:
- loss limits still work
- losses aren’t being “delayed” into a hidden blow-up
- max DD stays within your plan
- cost drag isn’t destroying small wins
A simple rule: win rate last, worst case first
- Check win rate last.
- Check worst-case risk first (max loss, max DD, max positions/lot exposure).
This one habit helps you avoid “high win rate only” EAs. Over time, your trading becomes less emotional and more systematic—built on design and verification.
Note: Backtests are based on historical data and do not guarantee future results. Make final decisions using realistic conditions (forward testing, small size first) and risk management you can actually tolerate.
