If an EA has a higher Profit Factor (PF), it’s a better EA, right?

No. You can’t judge an EA by PF alone.
If PF looks unnaturally high, the strategy may be hiding dangerous logic—such as delaying stop-losses, or using grid scaling / martingale-style position sizing.

What Is Profit Factor (PF)?
Profit Factor (PF) is a common metric used to evaluate EA backtest results. It represents “total profit ÷ total loss”.
In MT5 backtest reports, it appears as Profit Factor.
PF Formula (What It Means in MT5)
PF = Gross Profit ÷ |Gross Loss|
“Gross Profit” and “Gross Loss” here are the totals from closed trades (realized P/L).
Floating loss (unrealized P/L) is not included in PF.
How to Read PF: How Much You Make per $1 of Loss
In simple terms, PF tells you how many dollars of profit you made for every $1 of realized loss.
Example
- Gross Profit = 2,050 and Gross Loss = -1,000 → PF = 2.05
- This means the system made $2,050 of profit while taking $1,000 of losses.
PF Is Not the Same as Win Rate (A Common Confusion)
PF is not your win rate.
Even with a high win rate, PF can drop if the strategy occasionally takes big losses. On the other hand, a strategy can have a lower win rate and still achieve a higher PF if the winners are much larger than the losers.
What PF Tells You / What PF Doesn’t Tell You
- PF tells you: the balance between total realized profits and total realized losses
- PF doesn’t tell you: floating drawdown size, blow-up risk, drawdown depth, or the “quality” of losses (grid scaling, martingale behavior, etc.)
In the next section, we’ll look at a real example showing why PF alone can be misleading—where the same EA looks great in one period, but collapses when you change the test window.
Why Judging an EA by PF Alone Is Risky (The Same EA Can Break When You Change the Period)
Here, we compare the same EA by changing only the backtest period (starting point).
You’ll see that an EA can look amazing in a shorter window—with a high PF—yet fall apart as soon as you widen the timeframe.
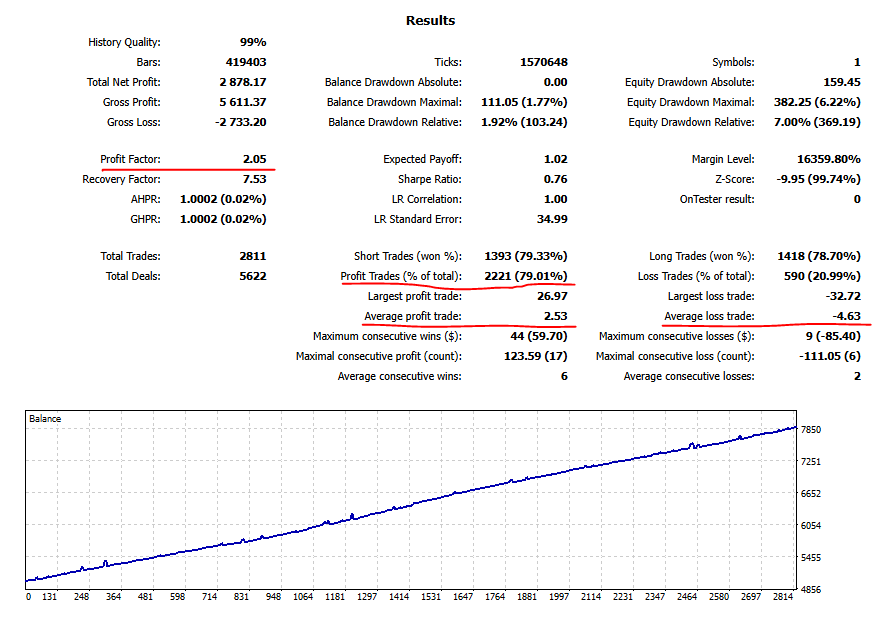
Case 1: In a Short Window, It Looks “Perfect” (High PF / Smooth Curve)
First, a backtest sliced from a certain period: Profit Factor (PF) is 2.05, with a win rate around 79%.
The equity curve is smooth, and based on the numbers alone, it looks like a “good EA.”
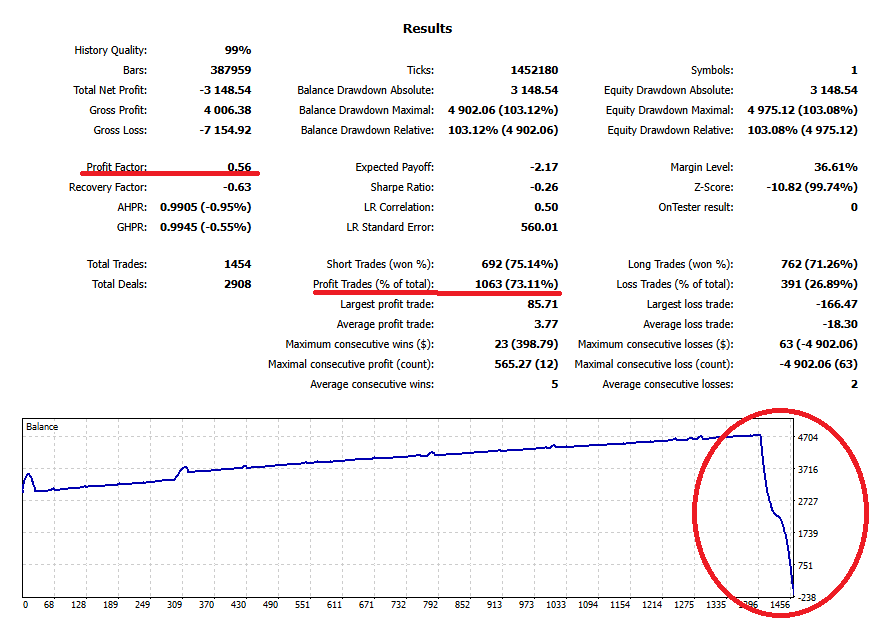
Case 2: Change the Start Date, and One “Hit” Wipes It Out (PF Drops / Equity Falls Fast)
Next is the same EA tested from a different start date over a longer period. It performs fine early on, but a single large loss near the end makes the equity curve collapse.
Here, PF drops to 0.56—the exact opposite conclusion from the short-window test.
What These Two Charts Prove: High PF Doesn’t Mean “Superior”
A high PF only means the realized profit-to-loss ratio looks good. It does not guarantee the strategy is hard to break (robust).
When PF is unusually high in a narrowly selected window, it may be hiding risks like these:
- Rare but massive losses that wipe out months (or years) of gains
- Delaying stop-losses / pushing losses into the future to keep short-term stats “clean”
- Regime changes where the market shifts and the strategy suddenly stops working
So, “High PF = safe” is not true.
Why PF-Only Evaluation Is Dangerous (It Misses the Risks That Matter)
Profit Factor (PF) measures the ratio of realized profits to realized losses.
That’s why PF can look great while still missing the kind of risk that can blow up an account.
Reason 1: The More You Avoid or Delay Stop-Losses, the Better PF Can Look
Strategies that don’t cut losses, or that delay stop-losses too long, can look excellent in certain backtest windows.
If the system rarely realizes losses, then on paper, losses don’t show up as clearly.
But that risk doesn’t disappear—it simply builds up. When price keeps moving against the position, the strategy can take a single catastrophic loss.
PF alone often fails to warn you about this structure.
Reason 2: Floating Loss (Unrealized P/L) Is Not Reflected in PF
PF uses only closed-trade (realized) results.
That means it won’t show how dangerous the system is when it’s sitting on a large floating drawdown, or how close it may be to a margin call.
As a result, an EA can look “excellent” by PF while the reality is simply: it keeps holding losses and not realizing them.
Reason 3: Grid Scaling / Martingale Systems Often Produce High PF—Until They Don’t
Grid scaling (averaging down) and martingale-style sizing are often designed around the idea of “not accepting a loss.”
They can rack up many small wins, which makes PF look strong.
The trade-off is that when the market trends hard in one direction, floating losses can expand rapidly, leading to a blow-up event.
Related articles:
Don’t Get Fooled by Grid (Averaging Down) EAs — Blow-Up Risk and How to Spot It (Tested with a Custom EA)
Don’t Get Fooled by Martingale EAs — Blow-Up Risk and How to Spot It (Tested)
Reason 4: Over-Optimization Trap (Strong Only in a “Convenient” Period)
If PF looks unnaturally high, the EA may have been tuned too tightly to a specific dataset or market condition.
With over-optimization (overfitting), the strategy can look perfect in historical data—but performance can break quickly when conditions shift.
Related article:
EA Overfitting (Over-Optimization): How to Detect It + A Pre-Purchase Checklist
Bottom line: PF is useful, but you must pair it with other checks—especially if you want to understand tail risk, floating drawdown, and blow-up resistance.
Key Metrics to Check Alongside PF (A Practical Robustness Checklist)
Profit Factor (PF) is helpful, but it doesn’t show how the EA loses or how easily it can break.
Here are the key metrics and checks you should review together with PF.
1) Average Win / Average Loss (The Foundation of Expectancy)
Start with Average Profit Trade and Average Loss Trade.
Even with a decent PF, if the average loss is very large (meaning it occasionally takes huge hits), the strategy can be unstable over time.
What to look for
- The balance of Average Win ÷ Average Loss (interpret it together with win rate)
- Whether the system is “small wins, huge losses” in disguise
Expectancy (Expected Payoff) as a quick reality check
Also check Expected Payoff in the MT5 report.
It estimates how much the system gains or loses per trade on average, and it can feel closer to “real trading” than PF in some cases.
Related article:
FX Trading Expectancy Explained: EAs, Win Rate, Risk-Reward, and Money Management
2) Equity Drawdown (The One PF Can’t Reveal)
Because PF is based on realized P/L, it cannot show how big the floating drawdown gets.
That’s why Equity drawdown matters.
Basic checks
- Don’t feel safe just because Balance drawdown looks small (floating losses can hide)
- Always review Equity Drawdown (max / relative)
- Deeper equity DD increases the risk of margin calls, forced liquidation, and stopping the EA under stress
Related article:
Drawdown (DD) for EAs: How to Read MT5 Reports, Why Equity Matters, and How to Set a Realistic Limit
3) Trade History (The Fastest Way to Spot Grid / Martingale Behavior)
Grid or martingale systems can look “clean” in summary stats.
The most reliable way to detect them is to inspect the trade history (Orders/Deals).
Red flags in trade history
- Lot size increases in multiples or jumps aggressively in steps
- Positions stack in the same direction (adding to losing trades)
- It holds large floating losses while taking frequent small profits
- It closes many positions at once at specific times (often creating a visible “loss spike”)
4) Number of Trades (The Small-Sample Trap)
PF swings a lot when the sample is small.
If PF is high with a low number of trades, it may simply be a “lucky” period.
What to look for
- Whether Total Trades is large enough
- If losing trades are unusually rare, the strategy may be pushing losses forward
- Whether the same tendency holds across different conditions (trend vs range) and different periods
Conclusion: PF Is a Filter—Robustness Is the Goal
PF is a useful first filter to screen EAs.
But the final decision should focus on robustness—how hard the strategy is to break.
Check average win/loss, expectancy, equity drawdown, trade history, and sample size together, and judge durability—not just “pretty” stats.
Related article:
EA Robustness: How to Choose an EA That Doesn’t Break + A Pre-Purchase Checklist
A Rough PF Guideline (Use It as a Signal, Not a Verdict)
Profit Factor (PF) often looks like a “higher is better” metric.
But PF only tells you the realized profit-to-loss ratio. It does not guarantee robustness.
That said, an PF that isn’t excessively high can sometimes hint that the system is taking losses properly (instead of endlessly delaying them).
On the other hand, an unnaturally high PF should prompt deeper checks—such as loss-delaying behavior, grid/martingale structure, or overfitting.
How to interpret PF ranges (rule of thumb)
- PF 1.1–1.3: Modest but realistic. If it stays positive after spreads/commissions, it may be worth considering.
- PF 1.3–1.8: Often a healthier range. Always confirm the balance with Equity Drawdown.
- PF ≥ 2.0: Strong on paper. But you should verify whether risky logic is involved (delayed stop-loss, grid/martingale behavior, over-optimization).
Important: Don’t use this “benchmark” by itself
PF changes a lot depending on market conditions, test period, and number of trades.
So treat these ranges as a guide for what to investigate next, not a pass/fail score.
Summary: PF Is the Starting Point—Choose EAs by “How Hard They Are to Break”
Profit Factor (PF) is useful for getting a quick sense of an EA’s performance.
But PF is only a realized P/L ratio. It does not show floating losses, blow-up risk, or the quality of losses.
As shown in the examples, an EA can look great with a high PF and a smooth equity curve in a short window—yet collapse from a different start date with one major loss.
So high PF does not automatically mean a robust EA. In fact, an unnaturally high PF can be a warning sign.
What to review together with PF
- Average win / average loss: Is it quietly “small wins, big losses”?
- Expected Payoff (expectancy): Is the per-trade edge stable?
- Equity Drawdown: How deep does it sink including floating P/L?
- Trade history: Signs of grid scaling, martingale sizing, lot spikes, or mass closes
- Total trades: Enough sample size, or just a lucky stretch?
The key is not flashy numbers, but robustness—whether the EA avoids fatal damage when the market changes.
Use PF as a starting filter, then validate drawdown, trade structure, and sample size before trusting an EA for long-term use.
Related article:
How to Read MT5 Backtests: Evaluate EAs by Settings, Equity Drawdown, and Trade History