
Introduction: Read MT5 Backtests by Pairing “Modeling” and “History Quality”
When you run a backtest in MT5’s Strategy Tester, you choose a Modeling mode, and the report shows History Quality.
They are different metrics, but you only get real value when you interpret them together.
Modeling controls how MT5 replays past price action (how ticks are handled), and the best choice depends on your EA type.
History Quality, on the other hand, is a rough measure of how clean and consistent the price history is (especially M1 data). It does not guarantee that your profit/loss is accurate.
So to read a backtest properly, you need to confirm: (1) which modeling mode you used, (2) how complete the underlying data is, and (3) whether costs and the test period match real trading.
What you’ll learn in this article
- How each Modeling mode differs, and which EA types each mode fits
- How to interpret History Quality (what it does and does not mean)
- What happens in “Every tick based on real ticks,” including “missing real ticks → fallback to generated ticks”
- How to make results more realistic with spread, commissions, slippage, and delay
- A practical workflow (rough screening → strict final checks) and how to interpret results
Bottom Line: Backtest Accuracy Depends on “Modeling × History Quality × Trading Costs”
- Modeling decides the “granularity” of price replay. Choose it based on your EA (short-term vs. longer-term, tight TP/SL, intrabar behavior) and your testing stage (screening vs. final validation).
- History Quality is mainly a proxy for how consistent your price history is (especially M1). A higher number often means “data is more complete,” but it does not guarantee accurate profits.
- Even with a good model and clean data, you can still “overstate” results if trading costs (spread / commissions / slippage / delay) are too optimistic. Make the final call only after testing under realistic cost conditions.
What “Modeling” Means in MT5: Choosing the Backtest Replay Method
In MT5’s Strategy Tester, you can select a Modeling mode for each backtest.
This setting controls how MT5 replays historical prices (how ticks are handled), and it directly affects how closely results match real trading behavior.
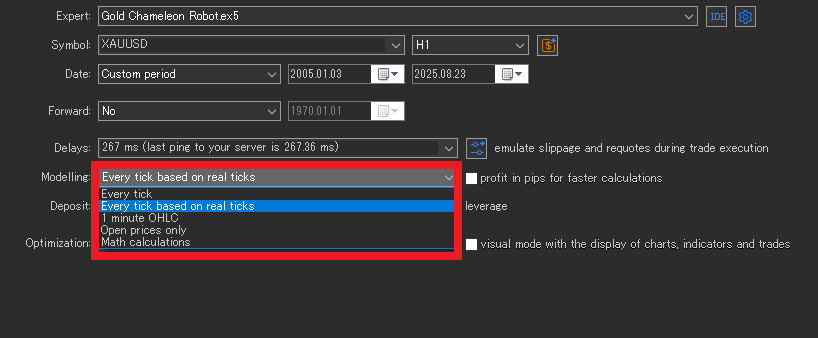
Here are the main options (names follow the MT5 UI).
Every tick based on real ticks
This mode replays recorded Bid/Ask real ticks. In theory, it’s the closest to real market behavior, so it tends to reflect spread widening and wicks/spikes more faithfully.
The downside is that the data set is large and results can vary by broker and data conditions. It also tends to take longer to finish.
- Best for: Very short-term EAs where a few pips decide outcomes, and EAs that rely heavily on intrabar behavior (stop orders, trailing stops, etc.)
- Note: Different results across brokers are not automatically “wrong.” Sometimes that spread in results is exactly what “more realistic” looks like.
Every tick
MT5 generates synthetic ticks mainly from M1 data.
It usually offers a good balance of speed and realism, but sudden jumps and extreme wicks can get smoothed. If your TP/SL is extremely tight, this mode may not reproduce behavior well.
- Best for: A solid baseline for day trading to swing EAs, and for comparing parameter sets (often the “workhorse” mode in practice)
- Note: Often not suitable for evaluating ultra-short-term “tiny edge” strategies (sub–few-pip differences)
1 minute OHLC
This mode evaluates using only each minute’s Open / High / Low / Close.
Because it simplifies intrabar sequencing (e.g., whether price hit the high first or the low first), error increases for EAs that rely on intrabar movement.
- Best for: First-pass screening for EAs that are not too short-term, and rough durability checks over long periods
- Note: EAs that manage stop/limit orders or trailing stops inside the bar can drift more from live behavior
Open prices only
This is the fastest option. It evaluates using only the first price of each bar.
Because it mostly ignores intrabar movement, it won’t reproduce behavior well for stop/limit orders, trailing stops, tight TP/SL, or tick-sensitive logic.
- Best for: Quick health checks for EAs that make decisions only on closed bars (e.g., H1+), to catch obvious logic bugs
- Note: Results can look “fine” while the live behavior is actually very different
Math calculations
This option is typically used to simplify calculations and speed up testing, rather than to reproduce execution precisely.
It’s better for early-stage direction checks than for final go/no-go decisions.
A Practical Modeling Workflow: Rough Screening → Strict Final Validation
Instead of locking into the heaviest mode from the start, tighten the model step by step. This keeps testing efficient and avoids getting stuck.
- Open prices only: Check for broken logic and obvious bugs (fastest)
- 1 minute OHLC: Get a broad sense of strengths/weaknesses across market regimes
- Every tick: Move closer to reality and narrow down candidates
- Every tick based on real ticks: Final validation for short-term EAs
The goal isn’t “always use the strictest model.” The goal is to confirm that the EA doesn’t collapse when the model changes.
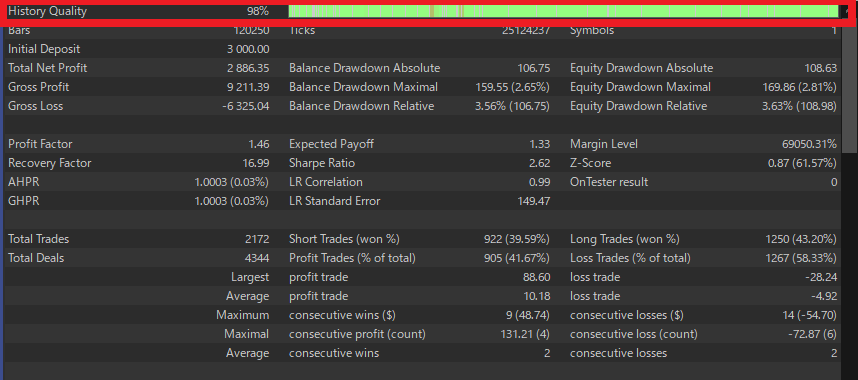
What “History Quality” Means: What It Shows and What It Doesn’t
History Quality in the MT5 report is a measure of price data quality—in simple terms, how “clean and complete” the data used in the test is.
In MT5, this value is mainly calculated based on the consistency of M1 (1-minute) data.
The official definition describes it as the percentage ratio of “correct M1 data” vs. “incorrect M1 data”, and gaps (missing data) are treated as “incorrect.”
MT5 also evaluates quality across multiple segments of the test period and then aggregates them.
So you shouldn’t read it as “data exists / data doesn’t exist.” Read it as a rough indicator of how consistently reliable M1 history is across the whole period.
What History Quality Does Tell You
- A proxy for M1 data consistency
Fewer gaps and fewer inconsistencies often mean the “materials” for the test are in better shape. - It reduces the risk of distorted results caused by broken data
If your history has holes or abnormal bars, the test can become unreliable before you even talk about edge. History Quality helps you avoid that basic trap. - A clear warning sign when it’s low
If History Quality is clearly low, question the price history first (re-download data, compare another server/broker) before judging the EA itself.
How Does History Quality Work with Real Ticks?
Even if you choose Every tick based on real ticks, MT5 still treats M1 data as the main reference for consistency. This is where many traders get confused.
- If M1 exists but real ticks are missing for that minute
MT5 does not discard the whole segment. It can generate ticks using Every tick to fill the gap.
→ So even in “real ticks” mode, parts of the period may continue using generated ticks as a fallback. - If ticks exist but M1 does not
Those ticks can be ignored, because MT5 prioritizes M1 as the more reliable reference.
→ So “ticks exist” does not always mean that minute is reproduced exactly as-is.
Because of this, don’t rely on History Quality alone when you use real ticks. Also check the Strategy Tester Journal to confirm
the real-tick availability range and whether any mismatch warnings appear.
What History Quality Does NOT Tell You (Common Misreads)
- Profit accuracy
It does not guarantee that total profit, profit factor, expected payoff, and similar stats match live results. Even with high History Quality, optimistic spreads or commissions can make performance look better than reality. - Realistic execution
It does not fully reproduce real execution issues such as thin liquidity, partial fills, order rejections, or requotes. - Realistic trading costs
It does not guarantee that your spread, commissions, slippage, and delay settings match real trading. Without realistic costs, you can still see big gaps versus live performance even with high History Quality.
Test Results: The Same EA Can Look Very Different Under Different Modeling Modes
Below are results from the same EA over the same test period, changing only the Modeling mode:
“Every tick based on real ticks / Every tick / 1 minute OHLC / Open prices only.”
The pattern is clear: the “rougher” the model, the better the performance tends to look.
That doesn’t mean the EA suddenly became stronger. It means the replayed price path (especially intrabar movement) and cost handling changed.
| Modeling | History Quality | Ticks | Total Net Profit | Profit Factor | Equity DD (Relative) | Total Trades |
|---|---|---|---|---|---|---|
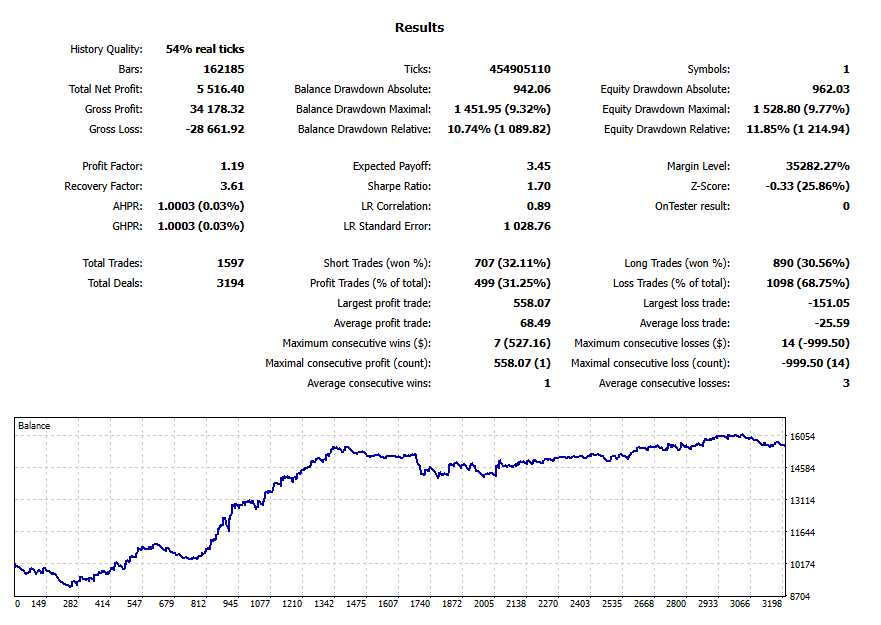
| Every tick based on real ticks | 54% real ticks | 454,905,110 | 5,516.40 | 1.19 | 11.85% (1,214.94) | 1,597 |
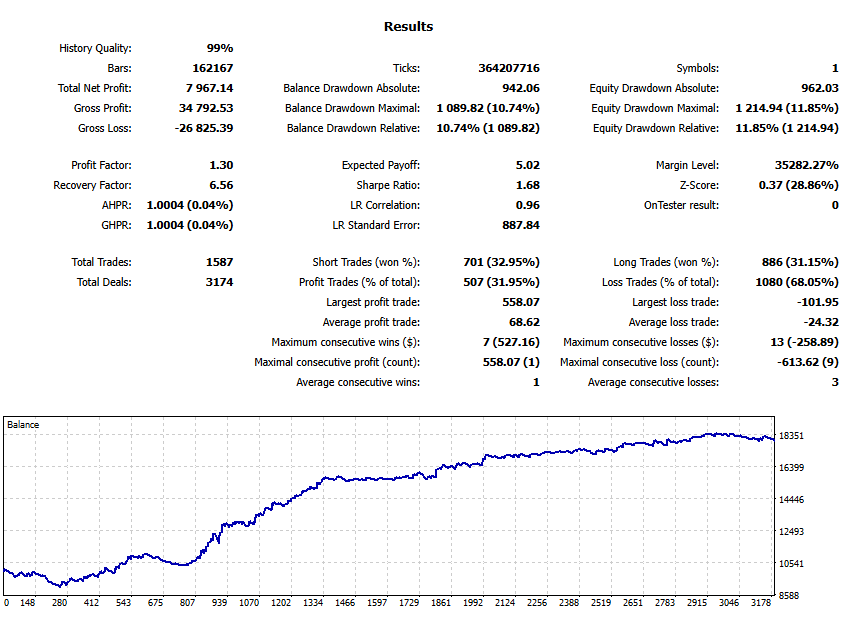
| Every tick | 99% | 364,207,716 | 7,967.14 | 1.30 | 11.85% (1,214.94) | 1,587 |
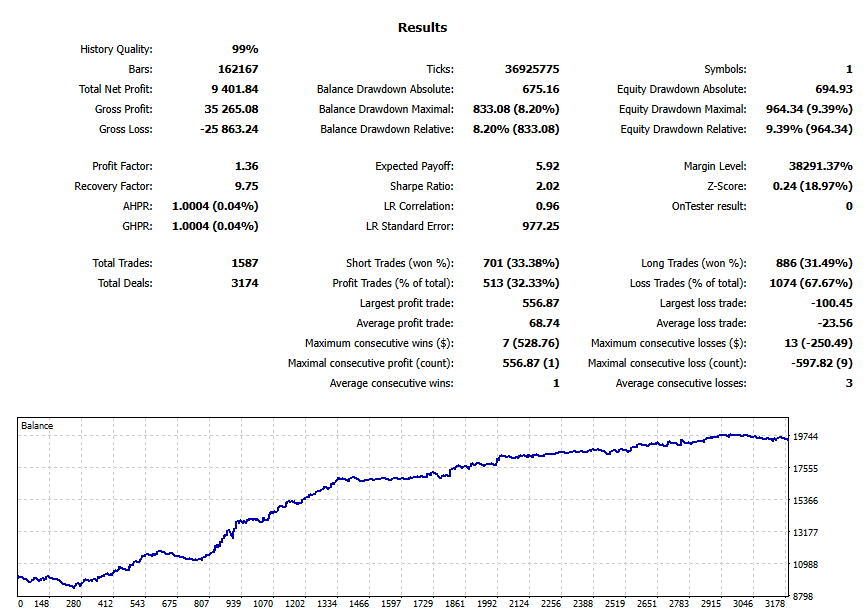
| 1 minute OHLC | 99% | 36,925,775 | 9,401.84 | 1.36 | 9.39% (964.34) | 1,587 |
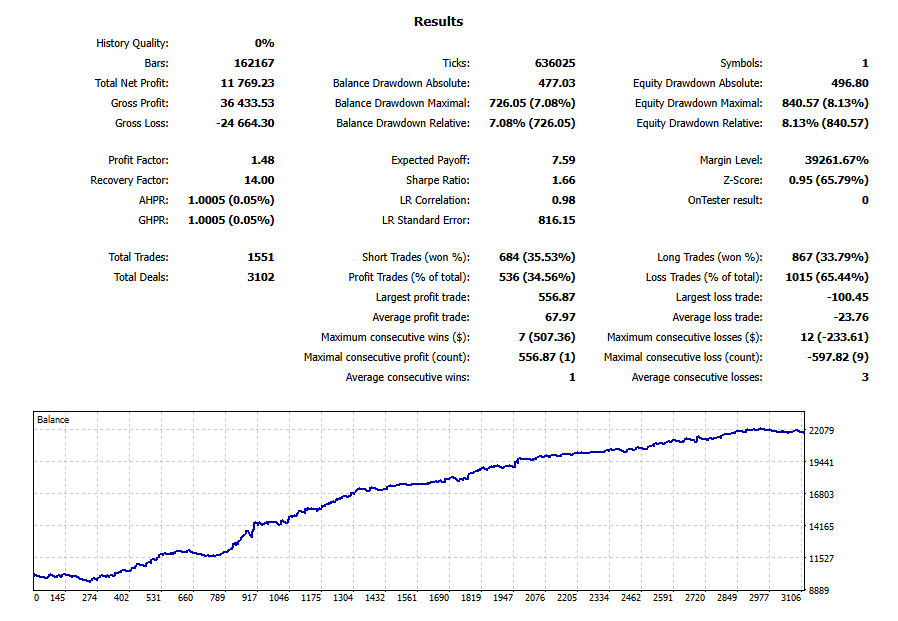
| Open prices only | 0% | 636,025 | 11,769.23 | 1.48 | 8.13% (840.57) | 1,551 |
Note: The English terms above match the MT5 screenshots (English UI). This article keeps English in parentheses only where it helps readers avoid confusion.
Why Do Results Change? Modeling Changes the “Path” Price Takes
Switching Modeling changes how MT5 reconstructs price movement. The biggest differences come from:
- How much intrabar movement gets reproduced: This directly affects stop orders, TP/SL, and trailing stops.
- How well spread widening and wick/spike behavior is represented: Short-term EAs feel this most.
- Which data MT5 prioritizes: MT5 generally uses M1 as its reference. If tick data is incomplete, MT5 may fill gaps using another method.
1) Real ticks: Closest to live behavior, so it often looks “worse”
With Every tick based on real ticks, MT5 replays recorded Bid/Ask ticks.
That means more of the “unpleasant reality” can show up—spread widening, sharp wicks, and noise—so performance often becomes more conservative.
In this test, Total Net Profit and Profit Factor are the lowest (5,516 / PF 1.19).
That’s not surprising: when execution becomes harsher, winners can shrink and stop-outs can increase.
What “54% real ticks” actually means
- This does not mean “History Quality is 54%.” It means only 54% of the tested period could be replayed using real ticks.
- When real ticks are missing for a segment, MT5 may generate ticks using Every tick as a fallback, so the backtest continues.
- In practice, check the Strategy Tester Journal to confirm where real ticks were used and whether any mismatch warnings appear.
2) Every tick: A practical “balanced” baseline (often the workhorse)
Every tick mainly builds synthetic ticks from M1 data.
It usually won’t capture extreme “rough” behavior as much as real ticks, but it still reflects intrabar movement far better than “Open prices only.”
That makes it a common choice for day-to-swing strategies and parameter comparisons.
Here, results are better than real ticks (Total Net Profit 7,967 / PF 1.30), while drawdown stays at a similar level.
That suggests the EA is influenced by intrabar movement, but not as heavily by extreme spikes or real-world spread behavior as the real-tick mode.
3) 1-minute OHLC: Intrabar sequence gets simplified, so stops can “survive” more often
With 1 minute OHLC, MT5 only uses each minute’s Open/High/Low/Close and simplifies the path inside that minute.
That weakens information about sequence—whether price hit the high first or the low first—so some “would-have-stopped-out” moments can get softened.
In this test, equity drawdown drops to 9.39% and performance looks stronger (Total Net Profit 9,401 / PF 1.36).
Use this mode to get a broad directional picture, but be careful: the tighter your stops and the more intrabar logic you use, the more optimistic this mode can become.
4) Open prices only: Fastest, but it can create an overly “friendly” world
Open prices only evaluates using only the first price of each bar, so most intrabar movement gets ignored.
That often reduces the kind of losses that happen inside a bar (stops, trailing behavior), which can make performance look unrealistically strong.
That’s exactly what you see here: the best Total Net Profit (11,769), the highest PF (1.48), and the smallest drawdown.
But this is mainly useful for a quick health check, not for final go/no-go decisions.
Note: “History Quality 0%” doesn’t necessarily mean broken data
- In Open prices only mode, MT5 does not rely on tick reconstruction or M1 consistency the same way, so History Quality can show 0%.
- Treat this as “History Quality is not meaningful for this mode,” rather than “data quality is zero.”
What This Comparison Tells You: Bigger gaps mean higher “tick sensitivity”
- If results improve as the model gets rougher, the EA is strongly affected by intrabar movement, spread behavior, and wicks.
- For short-term EAs with tight stops, do your final validation closer to Every tick based on real ticks.
- For EAs that only act on closed bars (e.g., H1+), a practical workflow is: Open prices only for fast screening, then tighten the model for confirmation.
In practice, the key is robustness: does the EA avoid “collapsing” when you tighten the model?
If profit and PF drop sharply the moment you switch to a stricter model, re-check whether the EA depends on a thin edge—and re-test under realistic spread / commissions / slippage / delay.
Common Misconceptions That Make Backtests Dangerous
Myth #1: History Quality 99% means “profit accuracy 99%”
Even with high History Quality, you can easily inflate results if your spread and commissions are too optimistic.
Profit Factor and Expected Payoff can look great on paper and still fail in live trading.
Myth #2: Real ticks will match live results perfectly
Real ticks are closer to reality, but live P/L is also shaped by execution, latency, liquidity, and operational issues.
Clean data alone won’t guarantee identical live performance.
Myth #3: The strictest model is always the “right” one
If an EA only makes decisions on closed bars, you don’t need the heaviest model for early screening.
On the other hand, if intrabar behavior matters and you test with Open prices only, you may miss major risks.
Backtest Limits: Even with Good Modeling and History Quality, Live Trading Is Different
Even if you use real ticks and see high History Quality, MT5 backtests cannot fully reproduce live trading.
A backtest is still a simulation based on price data. In real trading, results are shaped by execution, network conditions, and day-to-day operation.
If you understand these gaps, you’ll be far less likely to overtrust backtest numbers.
1) Execution gaps: Thin liquidity, rejections, and slippage can’t be perfectly reproduced
In live trading, even if the chart shows a price, your order may not fill at that price.
Depending on liquidity and your broker’s execution, you can see:
- Thin liquidity: slower fills or worse prices due to slippage (Related: What is slippage?)
- Partial fills: part of the order fills first, the rest fills later at a different price
- Order rejection: the order is not accepted under certain conditions
- Requotes: the quoted price changes and a new price is offered (Related: What is a requote in MT5?)
Backtests can approximate some of this, but they cannot fully reproduce order rejection patterns or true market depth.
Short-term EAs are especially sensitive to these effects.
2) Network and environment gaps: Latency and PC/VPS load change outcomes
In live trading, your EA runs on your device (PC/VPS) and sends orders to the broker’s server.
That means network and hardware conditions become part of your execution.
- Latency: VPS location, network quality, and server load can delay orders and worsen fills
- Device load: CPU/RAM pressure can delay EA logic, entries, and exits
- Interference: other EAs/indicators or many charts can slow processing
Backtests often assume an ideal environment, so they can’t fully reproduce delays caused by real latency or heavy load.
Related:
Why EAs freeze or lag: VPS optimization and MT5 performance basics
Choosing VPS locations for MT5/EAs: latency guidelines
3) Operational gaps: Stops, changes, and manual actions are outside the test
In real operation, “human-side” events also affect results:
- Stops in operation: reboots, MT5 updates, VPS outages, power issues
- Setting changes: lot size edits, trading hours changes, manual ON/OFF
- Manual intervention: moving SL/TP, closing trades manually, adding funds
A backtest assumes the same settings run from start to finish, so it does not include these real-world changes.
Conclusion: Use backtests to find failure points, not to “prove profits”
A backtest is a reference, not a guarantee.
What matters is not “does it win in good conditions,” but:
- Does it avoid blowing up under bad conditions (wide spread, slippage, delays)?
- Do results and behavior stay reasonable when you switch to a stricter model?
- Does the edge still remain after you account for realistic live gaps?
Treat backtesting as a stress test that reveals weaknesses. That’s how it becomes useful for real trading decisions.
Trading Costs: Lock in “Realistic Costs” Before You Worry About Precision
Before you debate Modeling or History Quality, confirm that your trading costs are realistic.
If costs are too optimistic, results can look great even when they won’t survive live trading.
Spread: Testing with an unrealistically tight spread is risky
Spreads widen during news and low-liquidity sessions.
If you test with a fixed, tight spread, your backtest often becomes too optimistic.
A safer approach is to test whether the EA still holds up with a wider spread.
MT5 setup note: Overriding the spread manually
- In Strategy Tester, click the
$(Symbol properties) icon next to the symbol - Enable Use custom symbol settings
- Enter Spread (points) manually
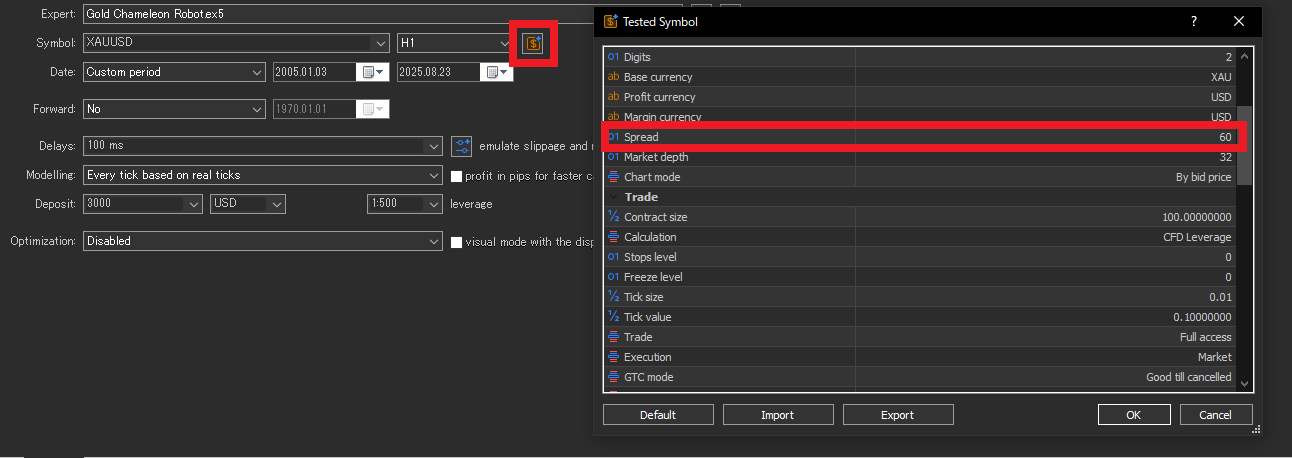
When does manual spread apply? (By modeling mode)
- Every tick based on real ticks: MT5 uses recorded Bid/Ask, so manual spread may not apply as you expect.
- Every tick / 1 minute OHLC / Open prices only: a fixed manual spread (points) is more likely to be applied.
Commissions: Missing settings make results look better than they are
If commissions are missing or mis-set, results can become overstated quickly.
In MT5 you can confirm this via Trade settings (the UI label may differ by language).
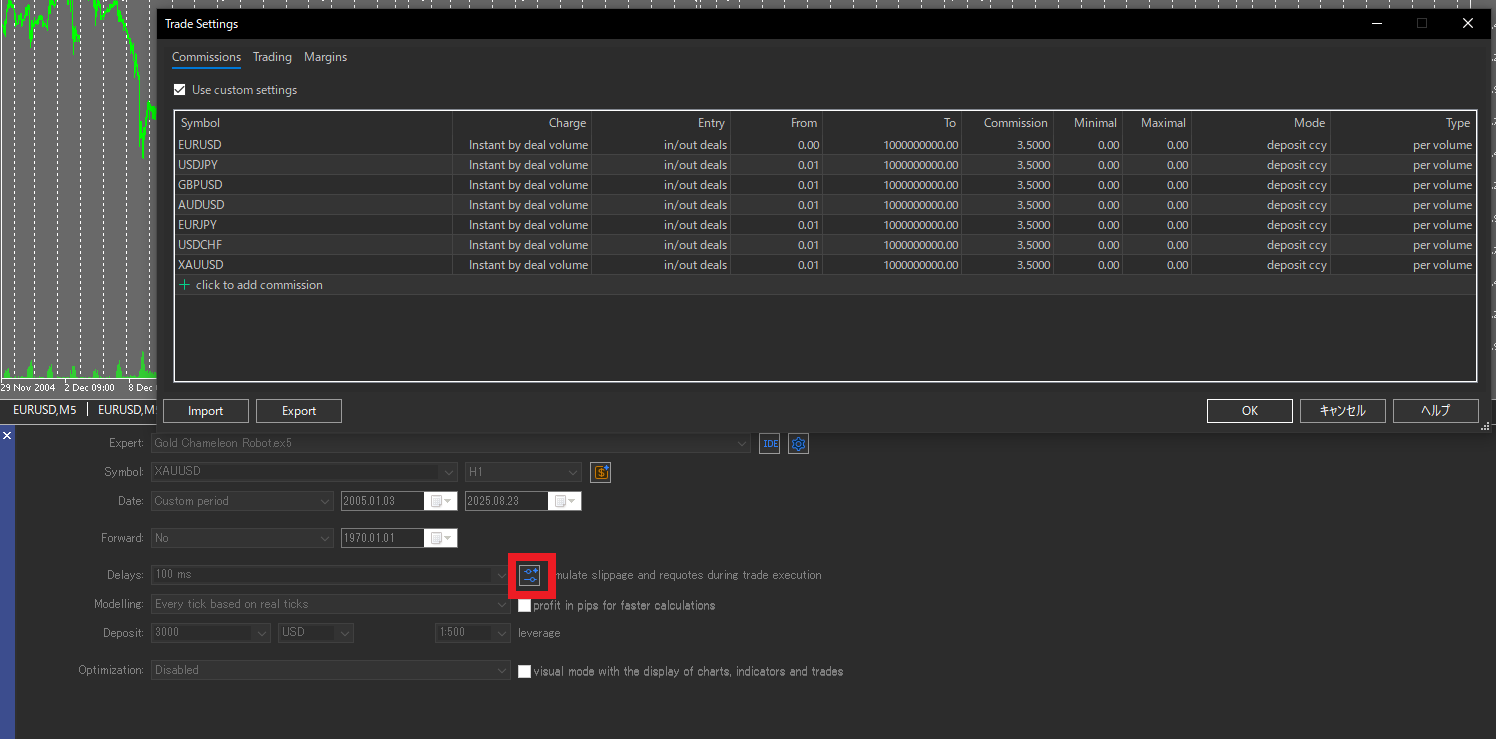
- Check: one-way vs. round-turn charging
- Check: per-lot vs. notional-based charging
- Check: correct currency conversion to your account currency
Slippage and Delay: Don’t make them easier than live trading
Backtests often assume milder slippage than live trading.
Also, if you set Delay too short, the test becomes unrealistically favorable.
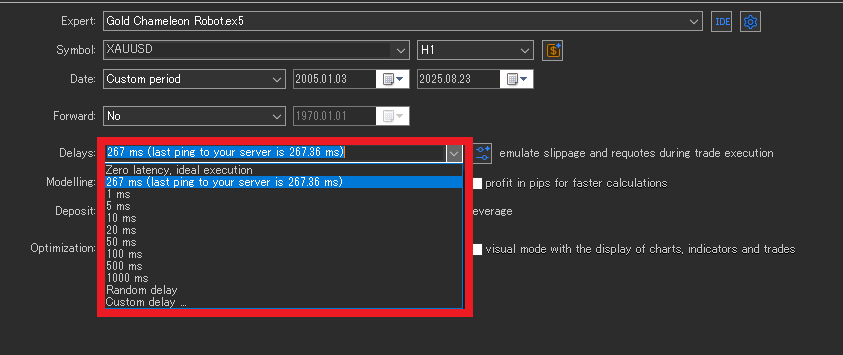
- Rule: Don’t set Delay shorter than your real ping (ms)
- Rule: Test a “worst case” combo: wider spread + slippage + delay
- Note: The Tester option “Emulate slippage and requotes during trading” helps you stress-test tougher conditions
Choosing the Test Period: Include the “Uncomfortable” Market Regimes
One of the biggest drivers of backtest swings is the test period.
With the same EA, you can make results look great (or terrible) by choosing only trend-heavy years or only range-heavy years.
So the goal is not to find the “best period,” but to check whether the EA stays stable when the market changes.
Why period choice matters: It can hide an EA’s weak spots
No EA works equally well in every market.
Some EAs shine in trends; others do better in ranges.
If you pick a convenient period, you may enter live trading without ever seeing where the EA breaks.
1) Mix regimes: Trend/Range × High/Low volatility
Deliberately include different market regimes to reduce bias:
- Include both trend and range periods
- Include both high volatility and low volatility periods
This makes it easier to see what your EA is good at—and where it struggles.
2) Use a longer span when possible; otherwise split into multiple windows
Ideally, test across multiple years so you cover different environments.
If that’s not practical, split the test into several windows, for example:
- Recent years (closest to today’s market)
- Earlier years (a different environment)
- High-stress windows (more sudden moves)
If the EA behaves consistently across windows, it’s less likely to depend on one “lucky” period.
3) Ensure enough trades: Too few trades is “luck,” not evidence
Even with a long test period, a small trade count can make results overly random.
With enough trades, win rate, average P/L, and drawdown stabilize and become more trustworthy.
- Few trades → easy to misjudge due to random streaks
- Many trades → noise averages out; patterns become clearer
Checklist: Turn Backtest Results into a Live Trading Decision
Backtesting is not about collecting pretty equity curves or chasing big numbers.
The real goal is simple: confirm whether the EA shows the same “behavior” in live trading.
Use this checklist to keep your process practical and consistent.
- Prefer EAs that don’t rely on tiny tick-level differences
If a strategy depends on sub–few-pip advantages or is extremely wick-sensitive, results often swing with modeling choices and broker conditions (spread and execution).
Related: Can scalping EAs work? Why reproducibility is often weak
EAs with clearer rules, longer decision timeframes (e.g., H1+), and positive risk-reward (RR) tend to show smaller gaps between backtests and live trading. - Give more weight to forward results on a real account
Backtests can be made to look better under certain assumptions. For final decisions, prioritize forward results when possible.
If you can, check third-party verified tracking (e.g., Myfxbook) and review drawdown, trade frequency, and behavior during stress periods. - Re-test under your own broker conditions
Vendor backtests may use a specific broker’s data or optimistic cost assumptions.
Re-run the same period with realistic spread / commissions / slippage / delay for your setup.
If a seller discourages user-side testing, treat it as a red flag. - Compare “how it wins,” not just total profit
Matching total profit is less important than matching behavior.
Compare live results vs. backtest results over the same period and see whether metrics stay in a similar range.
If the gap is large, question costs, trading hours, and execution assumptions first. - Re-test under harsher conditions
A stronger EA usually doesn’t collapse with small worsening of assumptions.
Test by tightening conditions like:- Wider spread
- Added slippage
- Added delay (don’t set it shorter than real ping)
If profit or PF falls sharply with a small change, the EA may depend on a thin edge.
- Be suspicious of “too perfect” results
Extremely high PF, unusually high win rate, and unrealistically small drawdown can signal grid/martingale behavior or overfitting.
Be careful if you see patterns like:- Results change dramatically when you switch to a stricter model
- Profit disappears when you widen spread slightly
- Performance breaks when you shift the test period
Consistency under small changes is a key sign of reliability.
Bottom line: The fastest route is not “find an EA that wins under perfect conditions.” It’s keep only the EAs that don’t collapse under bad conditions.
Summary: Use History Quality Correctly and Filter with Realistic Costs
- History Quality is a proxy for data consistency, not a profit guarantee.
- Modeling is not “the stricter, the better.” Choose it based on the EA type and your testing stage, and confirm results don’t collapse across multiple modes.
- Live gaps often come from spread / commissions / slippage / delay.
- Don’t cherry-pick periods. Mix regimes and look for failure conditions.
- Make the final call on robustness under bad conditions. Related: What EA robustness means and how to choose a strategy that doesn’t collapse