Introduction: Don’t Judge an MT5 Backtest by “Total Net Profit” and PF Alone
You can’t tell whether an EA (Expert Advisor) is good or bad just from a backtest report’s Total Net Profit or Profit Factor.
What really matters is repeatability (does it behave the same under the same conditions?) and durability (does it avoid fatal damage when market conditions change?).
In this guide, we break an MT5 backtest into four angles—Settings, Graph, Metrics, and Trade History—and turn it into a clear process:
which numbers to read, in what order, and what you should question.
We also include practical checks to spot early warning signs of “looks great on paper” strategies—like martingale or grid systems that stay pretty by holding big floating losses.
Note: A backtest does not guarantee future profits. That’s exactly why you should verify the full chain:
conditions (assumptions) → risk (usable equity) → what’s inside (trade history),
and ask: Can I picture how this EA fails?

What to Check in Settings: Don’t Misread the Assumptions
The first thing to check is not profit—it’s the test assumptions.
If you don’t confirm the period length, symbol, lot settings, initial deposit, leverage, and more, the numbers can mislead you.
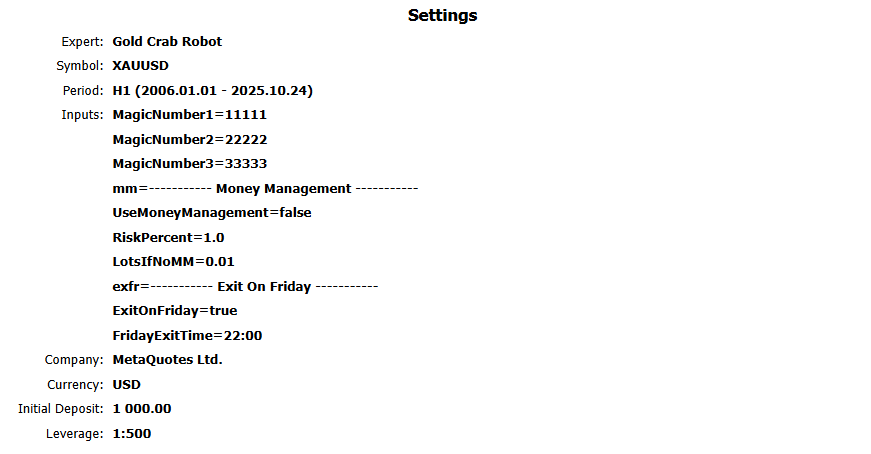
1) Test target and account conditions
- Expert (EA name): Make sure it matches the EA you intend to test. Watch out for version mismatches between a public release and a “test” build.
- Symbol: Confirm it’s the intended symbol (EURUSD / XAUUSD, etc.).
- Period (timeframe / date range): The shorter the period, the more “luck” affects results. Ideally, test over a longer range that includes different regimes (trend, range, sharp moves).
- Currency: The currency used for P/L in the report. This matters for comparison and interpretation.
- Initial Deposit: This changes how drawdown % looks, so always confirm it. Be careful of cases where a tiny deposit is used to make DD% look better.
- Leverage: A strategy that cuts losses properly can usually run even with low leverage. If the developer assumes extremely high leverage (e.g., 1:500+), it can hide a “hold-and-add” floating-loss strategy.
2) Decide first: “fixed lot” or “variable lot”
How you read a backtest changes a lot depending on lot sizing. First identify which one it is:
- Fixed lot: Lot size stays the same even if the balance grows
- Variable lot: Lot size changes with balance (compounding)
MT5 reports are basically money-based, so with variable lots, the size of wins and losses changes over time.
That makes maximum drawdown (DD) harder to judge.
Parameter names differ by EA, but many use switches like UseMoneyManagement / Use MM / RiskPercent.
Still, the most reliable method is to confirm the lot progression later in Orders.
3) Trading costs (spread/commission/slippage) are hard to verify from the report alone
With the MT5 HTML backtest report, assumptions like spread, commission, and slippage can be a black box.
Be especially careful with third-party reports.
If you can re-test yourself, it’s safer to include realistic costs (wider spreads, commissions, slippage).
Scalping EAs with small profit targets can look great in a cheap-cost backtest, then break down in live trading when costs are real.
Related:
MT5 EA Trading Costs Explained: Spread, Commission, Slippage & Swap (Backtest vs Live Reality)
Scalping EAs: Why They Often Fail on Live Accounts (Costs, Slippage, Execution)
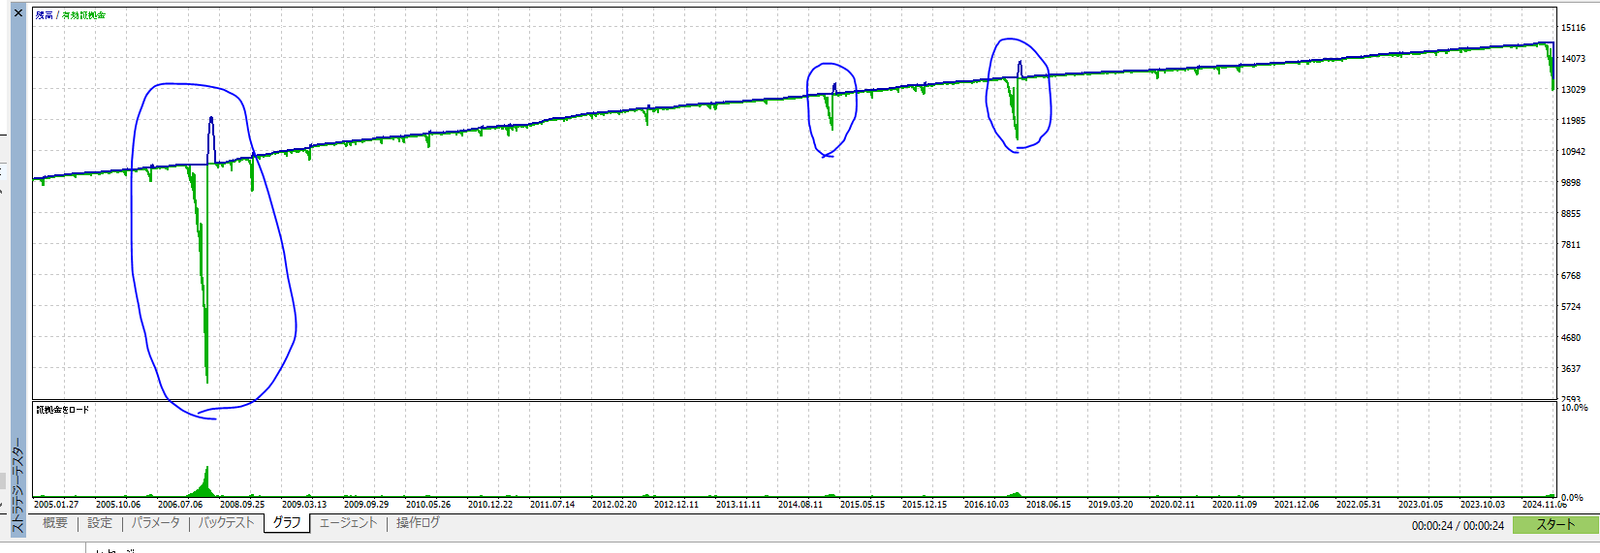
Judge the “Quality” of the Balance Curve: A Too-Perfect Uptrend Is Suspicious
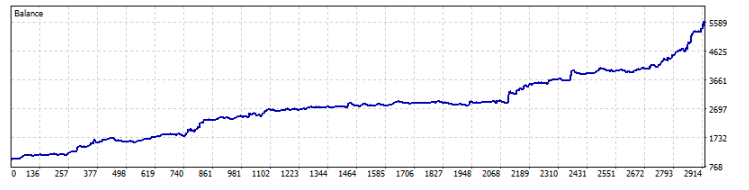
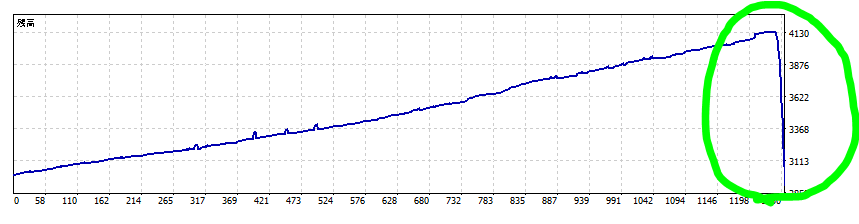
“No dips = excellent” is not true (it can be dangerous)
A curve that looks like it has almost no drawdown may be hiding a structure like grid averaging or martingale—
a design that avoids losses until a blow-up event arrives.
Strategies that delay stop-losses heavily—or effectively never cut—often look “clean” in normal times.
But once a strong trend, gap, or other tail event hits, they can wipe out the account in one move.
Related:
Don’t get fooled by grid (averaging-down) EAs – how to spot them and why they can blow up【tested with a custom EA】
Don’t get fooled by martingale EAs: how to spot the blow-up risk【tested】
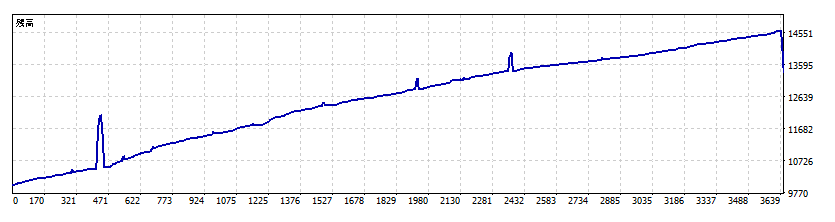
A dip in the balance curve isn’t “bad”—it can be proof of risk control
A drop in Balance can simply mean the EA is taking stop-losses.
EAs that can accept losses properly often survive better over the long run.
Chasing a “no-dip curve” is often the riskier choice.
The HTML report graph does not plot “Equity”
The graph in MT5’s HTML backtest report is basically the Balance curve.
But real risk shows up in Equity (including floating P/L).
So if you only look at the HTML graph, you may underestimate risk.
If only the HTML report is published, confirm risk using numbers—especially Maximum Equity Drawdown and Relative Equity Drawdown.
Bottom line: the graph is only the entry point. The final decision should come from the next chapter’s Results,
where you confirm Equity drawdown by numbers—and then validate the structure using Orders/Deals.
Result Metrics: Read Them Correctly to Understand EA Risk
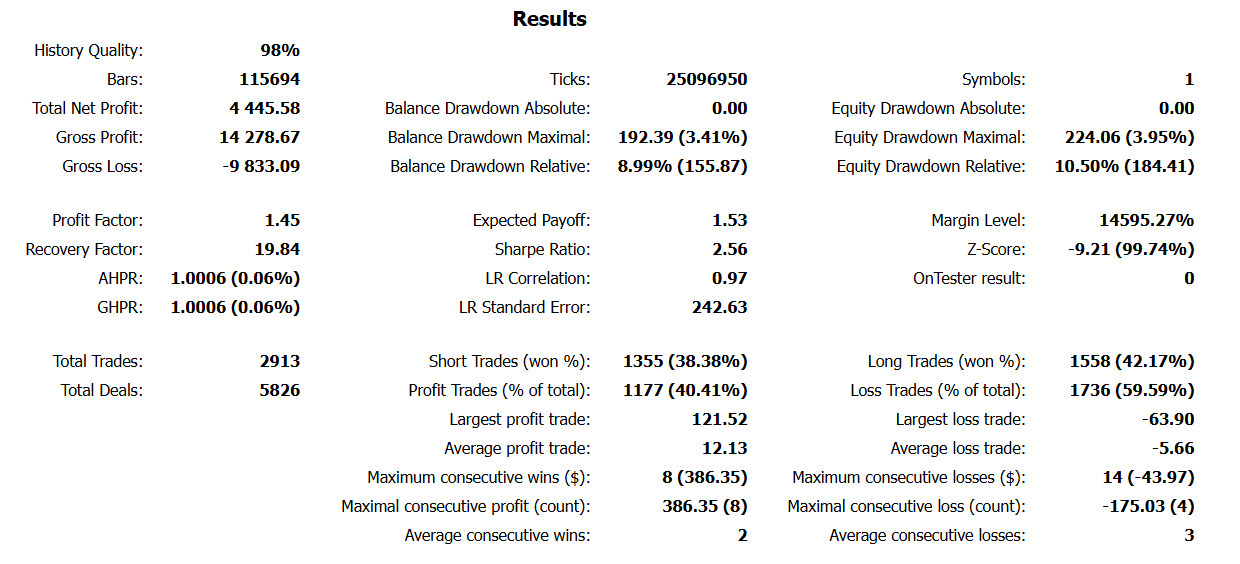
Use this order: (1) data → (2) sample size → (3) equity DD → (4) edge → (5) verify
- Data quality: History/Modeling Quality
- Sample size: Total Trades / Total Deals
- Risk: Equity drawdown (both % and amount)
- Edge: Expected Payoff / PF / RF
- Structure check: average P/L, largest loss, losing streaks, etc.
1) History/Modeling Quality: “high” isn’t automatically “good”
This shows the quality of the data and tick generation. Higher is generally better, but the value depends on the test method.
- Open prices only: Often shows high quality %, but can be weak for execution realism and intrabar movement
- Every tick based on real ticks: The % can be lower, but behavior tends to be closer to reality
If you care about repeatability, re-test (as much as possible) using a different broker / environment to reduce “it just happened to work.”
2) Gross Profit / Gross Loss / Total Net Profit
Total wins / total losses / the difference. These are easy to stare at, but judging by them alone is risky.
Always read them together with drawdown and average profit vs average loss.
3) Equity Drawdown: the most important number
This is the maximum drop including floating losses. It’s the key measure of strategy risk.
In MT5 it may appear as Max Equity Drawdown and Relative Equity Drawdown.
- % (relative DD): how much the account equity was cut
- Amount (absolute DD): whether the loss is realistically survivable with your capital
The bigger the gap vs Balance DD, the more you should suspect a “hold floating losses” structure (stop-loss not really working).
Related:EA Drawdown (DD) Explained: How to Read MT5 Reports, Focus on Equity DD, and Set a Risk Limit
4) Balance Drawdown: floating losses are not included
This is drawdown based on closed P/L only. Because floating losses are excluded, prioritize Equity DD for risk judgment.
5) Win rate (Profit Trades % / Loss Trades %): never judge by this alone
Win rate doesn’t tell you whether an EA is good. Combine it with average profit / average loss (payoff ratio).
- Even with a high win rate, if average loss is bigger than average win, it can fail over time (many small wins, one big loss).
- Even with a low win rate, if average win > average loss, it can still be profitable.
If the win rate is extremely high (e.g., 80%+), suspect a structure that carries rare but huge losses (martingale/grid). Verify using the trade history (Orders/Deals).
Related:Stop Chasing Win Rate: How to Evaluate Forex EAs with Expectancy, Risk-Reward & Drawdown
6) Profit Factor (PF)
PF = Gross Profit ÷ |Gross Loss|
PF > 1 is the minimum requirement, but PF alone is never enough.
Some EAs collapse the moment you apply stricter costs (spread, commission, slippage).
Also, an unnaturally high PF can be “manufactured” by delaying stop-losses or effectively not using them.
Related:Profit Factor (PF) Explained: Why a High PF Doesn’t Mean a Safe Forex EA
7) Expected Payoff: positive, and strong enough to beat costs?
This is the average P/L per trade (in account currency). The key questions are:
Is it above zero? and Is it large enough to overcome costs?
- Expected Payoff > 0: positive on average
- Too small: spread/slippage can easily flip it negative
Related:FX Trading Expectancy (EV) Explained: EAs, Win Rate, Risk-Reward & Money Management
8) Recovery Factor (RF)
RF = Total Net Profit ÷ Maximum Drawdown
This is a rough indicator of “how well it recovers after a hit.” It’s often read together with PF,
but don’t judge RF alone. Combine it with Equity DD size, recovery time, and the Orders/Deals structure.
9) Total Trades / Total Deals: fewer trades means more luck
Trades are round trips; Deals count executions (entry + exit), so Deals are usually about 2x Trades.
The fewer the trades, the more results depend on luck. Check whether performance is uneven across years as well—this helps you judge repeatability.
10) Average profit / average loss: spot “many small wins, one big loss”
Ideally, average profit > average loss.
If average loss is much larger, one losing trade can erase many wins—classic “small wins, one big loss” behavior.
11) Largest profit / largest loss: watch out for outliers and one-shot blow-ups
- Largest profit is huge: Possible outlier dependence (“it got lucky”). Compare against averages.
- Largest loss is massive: Possible weak/no stop-loss, holding floating losses, or adding to losers—“one-shot death” risk.
12) Consecutive wins/losses: focus on how it loses, not the count
More important than the streak count is whether lot size increases during losing streaks, and whether a loss-cutting mechanism (stop-loss) actually works.
If losing streaks are unusually rare, suspect hidden large-loss behavior and verify in Orders/Deals.
Important Notes: Variable Lots (Compounding) and the Price-Scale Trap
MT5 reports are money-based: variable lots make statistics wobble
With variable lots, the same adverse move in pips can produce very different money losses depending on when it happens.
That makes average P/L, largest loss, DD (amount), and more less stable—and harder to evaluate.
A practical split is:
- Fixed lot: understand absolute DD and estimate a safer “required capital” range
- Variable lot: test the balance-based sizing and focus on Equity DD (%)
Related:EA Lot Size & Position Sizing: Fixed vs Auto Lot, Risk % Rules, and Starting Deposit Math
Be careful with price scale (e.g., XAUUSD)
For symbols like XAUUSD, where price level can change a lot over long periods, money-based metrics can look very different depending on the era.
Even if it’s “1%,” if the price level is 10x, the money impact changes too. Splitting the period and thinking in % terms can make comparisons safer.
Trade History: Use Orders/Deals to Confirm a “High-Risk Structure”
Even if the metrics look strong, the trade history—Orders and Deals—often reveals structures like
“adding lots,” “no stop-loss,” or “evenly spaced grid entries.”
Don’t stop at the graph or win rate. Always confirm the history.
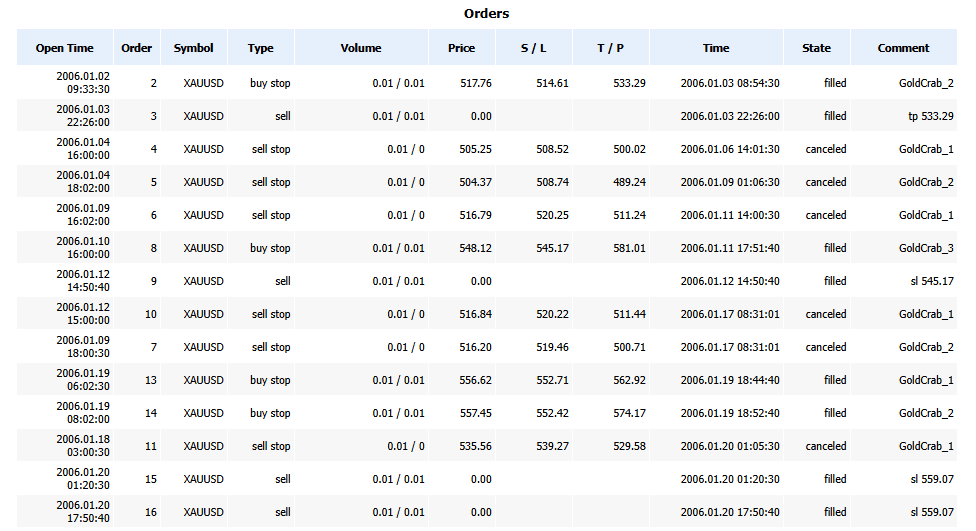
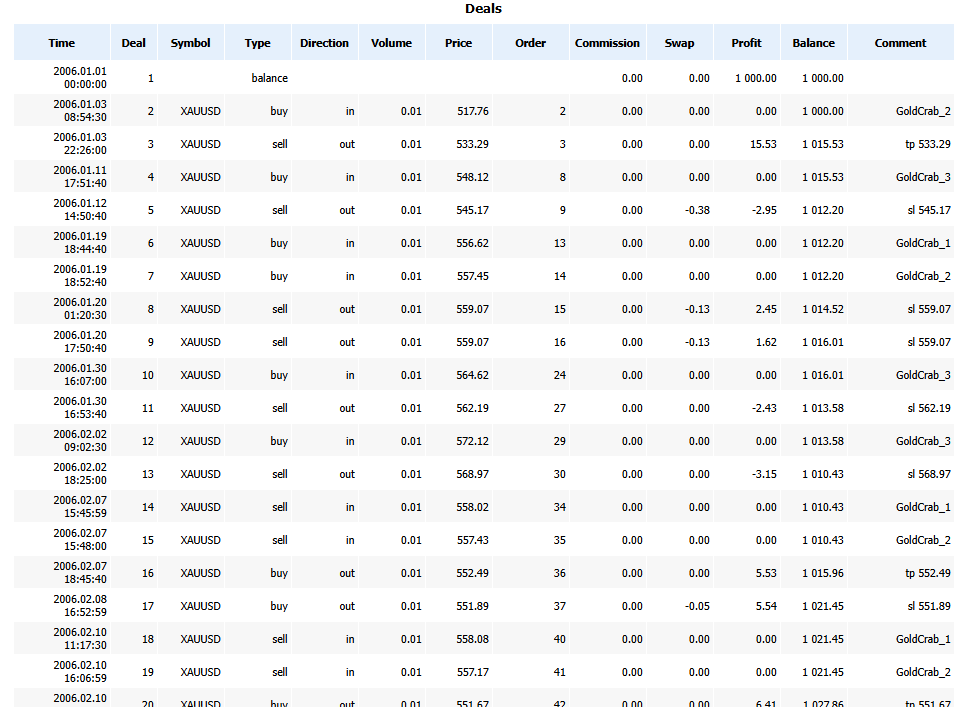
1) Lot progression (Volume): identify martingale or compounding
Doubling lots (0.01 → 0.02 → 0.04…), or increasing lots only during losing streaks, is classic martingale behavior.
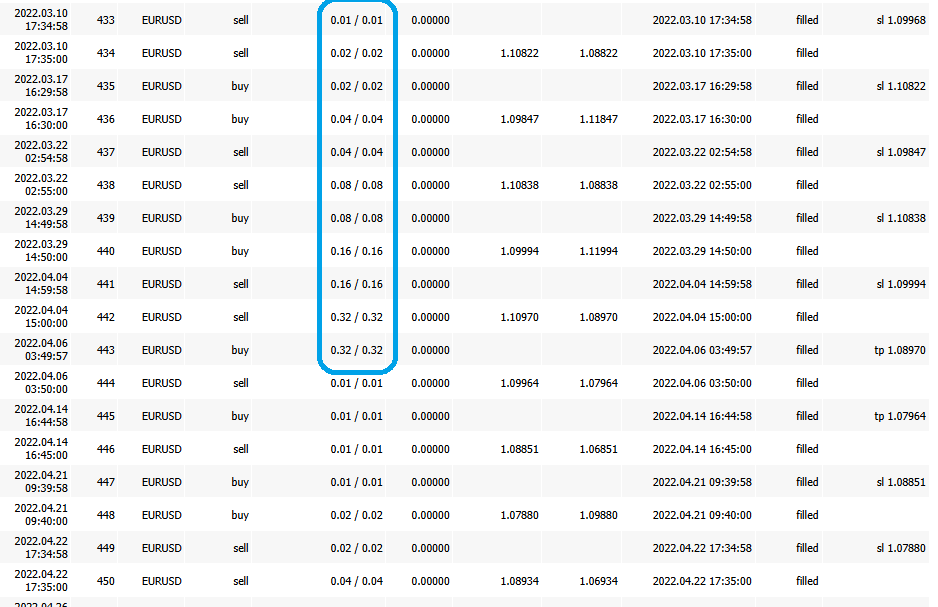
2) Stop Loss / Take Profit set to 0.00 is a red flag
In Orders, S/L = 0.00 (not set) deserves extra caution.
It often leads to a habit of holding deep floating losses, and damage can grow during gaps or sharp moves.
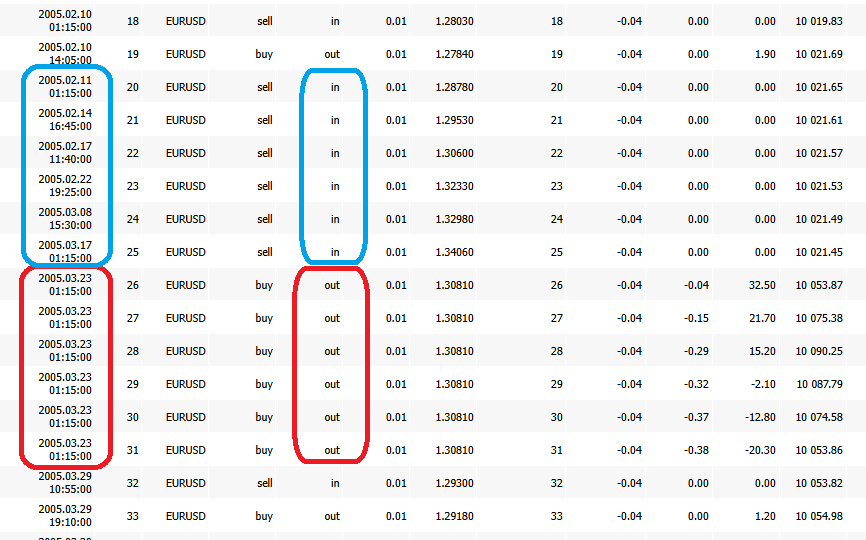
3) Grid (averaging down) clues: evenly spaced scale-ins / simultaneous close
If Deals show same-direction entries stacked at even price steps,
or multiple positions closed at the same timestamp, suspect a grid system.
Use MFE/MAE to Spot “Take-Profit Efficiency” and “Floating-Loss Dependence”
Using each trade’s MFE (Maximum Favorable Excursion) and
MAE (Maximum Adverse Excursion), focus on two things:
- Take-profit efficiency: Does it often “let winners run” but fail to capture much of the move?
- Floating-loss dependence: Does it need to survive deep drawdowns just to win?
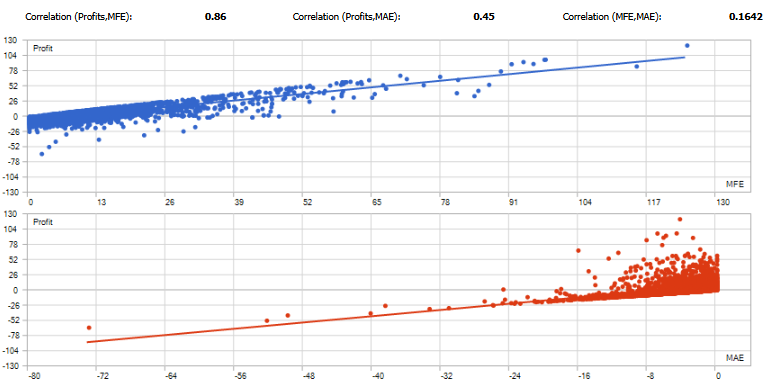
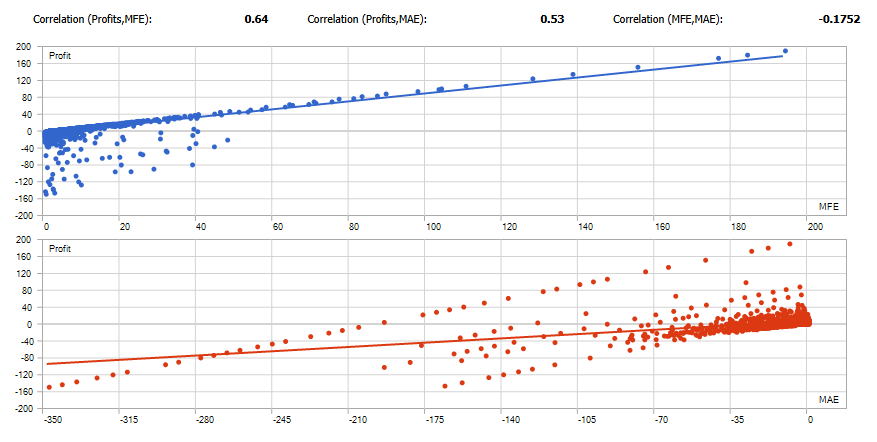
Start with correlations to get the big picture
- Corr(Profit, MFE): Higher suggests it converts favorable movement into profit (rough guide: 0.7+)
- Corr(Profit, MAE): Checks whether deep adverse movement is “required” (strong positive correlation can be a warning)
- Corr(MFE, MAE): Lower suggests favorable moves and adverse moves are more independent (price tends to move cleanly in your favor)
Warning signs
- Points cluster in the bottom-right → possible floating-loss holding (stop-loss too wide / averaging down)
- Large MFE but profit doesn’t grow → exits are too early (take-profit design issue)
- Long holding-time points concentrate bottom-right → “holding and hoping” becomes normal (weak vs weekend gaps and swap)
Tip: If you normalize MFE/MAE using ATR or similar (as a %), comparisons become more stable across symbols and periods.
Check Time/Day/Month Bias to Confirm “Repeatable Profit Sources”
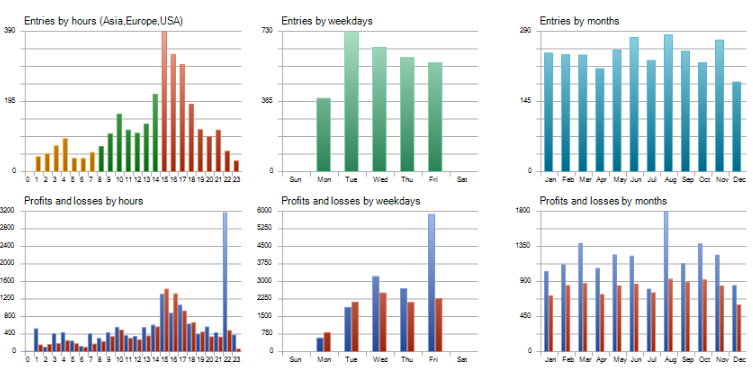
Check whether profits are concentrated only in certain hours, weekdays, or specific months.
Also confirm it matches the EA’s logic (e.g., targeting Tokyo session, London session, etc.).
Use Holding Time to Spot “Holding Through Deterioration”
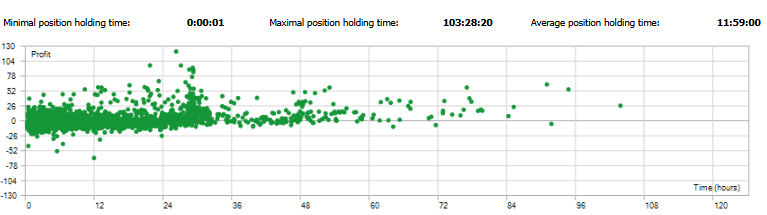
If losses stand out on the right side (long holds), suspect a structure that “holds and endures” when trades go bad.
Longer holding times also increase exposure to swap, weekend gaps, and sharp moves.
Other Metrics (Sharpe / AHPR・GHPR / LR Standard Error, etc.): Useful Hints, But Don’t Overtrust Them
The Results section lists many metrics beyond PF and DD. They can offer clues, but they are heavily affected by conditions (period, symbol, costs, lot sizing) and by distribution bias.
That’s why they’re rarely strong enough to decide whether an EA is good by themselves.
Use them as training wheels. For the final decision, validate with Equity DD and the Orders/Deals structure.
Sharpe Ratio: a measure of smoothness, not a final verdict
Sharpe Ratio is often explained as “return divided by risk (volatility).” In practice, it’s used as a rough measure of how stable the P/L path looks.
- Higher tends to mean a smoother-looking equity curve (smaller swings)
- Low or negative can mean big swings or unstable performance
But don’t overtrust Sharpe, because:
- It changes easily with timeframe and test period (it can be regime-dependent luck)
- Floating-loss holding (equity spikes down) may be understated in some views (apparent stability can be “made”)
- With few trades, it becomes statistically noisy
Even if Sharpe looks good, if Equity DD is large or Orders/Deals show adding to losers or no stop-loss, downgrade the evaluation.
AHPR / GHPR: be careful with how compounding “looks”
AHPR (Arithmetic Holding Period Return) and
GHPR (Geometric Holding Period Return) average per-trade returns.
- AHPR: simple average (more sensitive to outliers)
- GHPR: closer to a compounding-style average, usually more conservative than AHPR
How to read them: a big gap suggests instability or outlier dependence
- AHPR and GHPR are close: returns may be relatively consistent
- AHPR is high but GHPR doesn’t rise: results may rely on a few big wins (outliers) / high variability
Still, don’t conclude from these alone—especially with variable lots (compounding) and money-based reporting.
Always confirm alongside Largest loss and Equity DD.
LR Correlation: “too strong” is not automatically reassuring
LR Correlation is sometimes described as “how straight the profit curve looks.”
- Higher often means a smoother-looking uptrend
But here’s the trap: floating-loss holding systems (grid/martingale) can look very smooth until the blow-up event.
So “high = safe” is not true.
Treat LR Correlation as a visual helper only, and confirm the structure with Equity DD and Orders/Deals.
LR Standard Error: small doesn’t mean it won’t break
LR Standard Error shows how much the curve deviates from the regression line. Generally, smaller means less deviation.
But that’s still only under past conditions. It won’t fully reflect regime shifts (trend ↔ range), cost changes, sharp moves, or gaps.
So even with a small LR Standard Error, if largest loss or Equity DD is large, lower the rating.
Z-Score: checks “bias” in win/loss sequence (limited use)
Z-Score can help detect whether wins and losses are clustered in unusual ways (e.g., too many streaks).
But streak patterns depend heavily on the strategy type (trend-following, mean reversion, breakout), so it’s not a deciding factor.
If a value looks concerning, use it as a trigger to check Orders/Deals:
Does lot size increase during losing streaks? Does stop-loss actually work?
Use these metrics as references—final confirmation is DD + trade history
Sharpe, AHPR/GHPR, and LR metrics can reduce blind spots, but if you over-weight them, you may end up overrating an EA that is simply “pretty” on the surface (holding floating losses / adding to losers).
Summary: Read MT5 Backtests as “Settings → Equity DD → Orders/Deals”
A backtest isn’t about “looking pretty.” What matters is whether you can predict how it breaks.
Don’t stop at the graph or summary stats (PF / Total Net Profit). If you dig into Equity and trade history, your EA selection becomes much sharper.
When you’re unsure, go back to the checklist below. It helps you stay consistent.
Minimum checklist
- Settings: Are Symbol / Period / Initial Deposit / Leverage / cost assumptions realistic?
- Data quality: Is History/Modeling Quality extremely biased (too favorable or too unfavorable)?
- Equity DD: Are both % and amount acceptable? (Don’t judge by Balance alone.)
- Trade count: Are Total Trades sufficient, and not overly concentrated in specific years/months?
- Expected Payoff: Is it positive, with enough cushion above costs?
- Verification: Did you check “how it loses” using average P/L and largest loss?
- Final audit: In Orders/Deals, are there signs of adding lots, missing S/L, or grid patterns?
Related:EA Robustness Explained: How to Choose a Forex Trading Robot That Won’t Blow Up