If an EA publishes a Monte Carlo analysis, that means it manages risk properly—so it’s safe, right?

Conclusion: Not necessarily.
Monte Carlo analysis mainly uses closed-trade results. It randomly reshuffles the order of wins and losses to estimate the range of worst-case outcomes—such as maximum drawdown (Max DD).
However, depending on the EA type, there are major blind spots where important risks don’t show up clearly. So it’s critical not to assume “Monte Carlo = safe.”
What kind of blind spots are we talking about?
Beginners tend to get caught by these four, especially:
1) Unrealized loss (Equity DD): For systems that “hold and wait” through floating losses (e.g., grid / averaging down, martingale), Monte Carlo tables can look “safe” even when the real risk is large.
2) Compounding (variable lot size): If lot size changes with balance, simple reshuffling often misstates risk.
3) Price level changes: Over long periods, price scales change, and fixed-pip assumptions can distort evaluation.
4) Loss clustering (autocorrelation): Simple shuffling breaks “clusters” of losing streaks, which can make results look milder than reality.
So does that mean Monte Carlo analysis is useless?
No. It’s useful when you use it for the right purpose.
Monte Carlo analysis is good for understanding the variation in closed-trade outcomes and turning that into guidelines for lot sizing and capital planning.
But in real trading, you only get closer to a “safety” judgment when you also check unrealized loss (Max Equity DD), margin usage, stop-out rules, and more—separately.
In the end, what should I look at to spot a “dangerous EA”?
In this article, using a breakout EA with small losses and large wins and a grid (averaging-down) EA as examples, I’ll explain:
• How to read Monte Carlo results correctly
• Patterns that look safe but are actually risky
• Simple checkpoints beginners can follow without getting lost

Goal of This Article: Key Points and Warnings for Monte Carlo Analysis
Monte Carlo analysis takes backtest trade results and randomly reshuffles the order of wins and losses to estimate
the range of worst-case outcomes (drawdown and P/L variation).
That said, Monte Carlo analysis isn’t a silver bullet. Because it has blind spots like the ones below, it’s risky to judge an EA as “safe” based only on how the results look.
- Unrealized loss (Equity DD): Systems that endure floating losses (e.g., grid / averaging down, martingale) can be underestimated
- Compounding (variable lot size): If lot size changes with balance, simple reshuffling struggles to reproduce real risk
- Long-term price scale shifts: When price levels change across decades, fixed-pip assumptions can distort evaluation
In this article, using a breakout EA (Gold Crab Robot) and a grid (averaging-down) EA as examples,
I’ll explain how to read Monte Carlo results correctly and the blind spots beginners often miss, in a clear, practical way.
Monte Carlo Analysis Basics: A Way to Cover Backtest Weaknesses
Backtests are useful, but you must remember this: a backtest is only one historical path—one scenario.
Even with the same EA, changing only the order of wins and losses can drastically change max drawdown and how the equity curve looks.
That’s where Monte Carlo analysis comes in. It uses the historical trade results, reshuffles (resamples) the order,
generates many alternative histories, and then checks the spread (distribution) of outcomes.
What Can Monte Carlo Analysis Tell You? (4 Common Metrics)
- Maximum drawdown (Max DD): How deep the account could drop in a worst-case scenario
- Final P/L range (Net Profit range): How widely profits can vary (best vs. worst outcomes)
- Max consecutive losses: Whether your capital and psychology can survive the losing streak
- Risk of Ruin: An estimate of the chance of reaching a defined “failure” threshold
The key point: Monte Carlo analysis doesn’t focus on one outcome. It focuses on a distribution of many possible outcomes.
That helps you understand how painful things could get when you hit a bad sequence.
Confidence Level: A Beginner-Friendly Way to Read It
Monte Carlo results often show a confidence level.
Put simply, it’s a scale for how pessimistic (or optimistic) you want to be.
- 50% (median): A “middle” scenario (close to an average sequence)
- 90% / 95%: More pessimistic; many traders use this for risk planning
- 99%+: Very pessimistic; safer, but sometimes too strict to be practical
If you see something like “Max DD at 95% confidence”, it generally means:
“In about 95 out of 100 simulated paths, Max DD stays within this value” (exact wording varies by tool).
In practice, beginners should base lot sizing and capital requirements on a pessimistic line like 95%.
Accounts usually blow up not in the “average” case, but when bad sequences keep coming.
How to Use It in Real Trading (Lot Sizing and Capital Planning)
A simple way to apply Monte Carlo results:
- Check the pessimistic Max %DD (e.g., at 95% confidence)
- Decide your allowed drawdown (example: 20%)
- Reduce lot size so the strategy stays within your allowed DD
In short, Monte Carlo analysis is not “proof that an EA performs well.”
It’s a tool to design position sizing and capital plans that can survive a bad run.
Next, we’ll walk through two real examples and show what to read and why.
[Example 1] Breakout EA (Gold Crab Robot): How to Read the Monte Carlo Analysis
Here, I’ll use Gold Crab Robot as a breakout EA example (small losses, larger wins) and explain how to go from
backtest → Monte Carlo → real-world judgment in a beginner-friendly way.
Related: Can Breakout EAs Really Work? Verification with a Self-Built EA — Pros, Cons, and Practical Tips
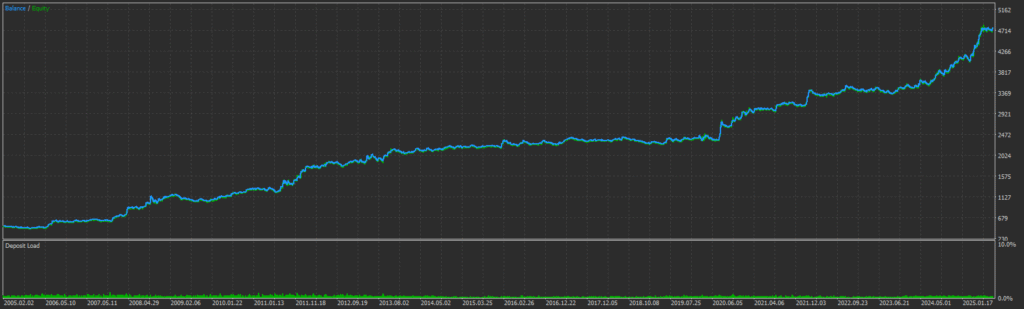
Assumptions (for this example)
Fixed lot 0.01 / Initial balance $500 / Period: Jan 2005 to Aug 2025 (MT5 report)
1) Check the Backtest First (How to Read the MT5 Report)
Before looking at Monte Carlo results, confirm the raw backtest data is healthy.
Monte Carlo is basically a re-ordering of past trades, so if the source data is distorted, the simulation won’t be trustworthy either.
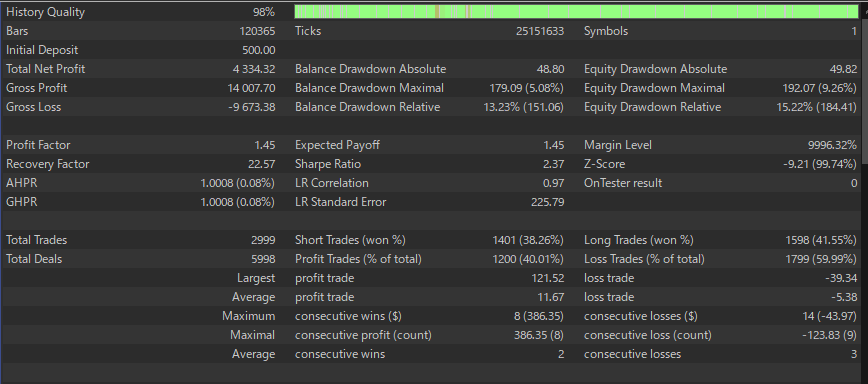
Key metrics (excerpt)
- Total trades: 2,999 / Win rate: 40.01% (a low win rate can still work for “small loss, large win” systems)
- Profit Factor: 1.45 / Sharpe Ratio: 2.37 / Recovery Factor: 22.57
- Max DD (Balance): $179.09 (5.08%) / Max DD (Equity): $192.07 (9.26%)
- Max consecutive losses: 14 (-$43.97) / Avg win: $11.67 / Avg loss: -$5.38
Beginner note
Balance DD is based on closed trades (realized P/L), while Equity DD includes floating P/L (unrealized loss).
In live trading, the scary moments usually come from the equity side, so always check both.
2) How to Read Results by Confidence Level
The confidence level in the table is basically a scale for how pessimistic you want to be.
Many traders focus on the 95% row because systems tend to fail not during “average” sequences, but during extended bad sequences.
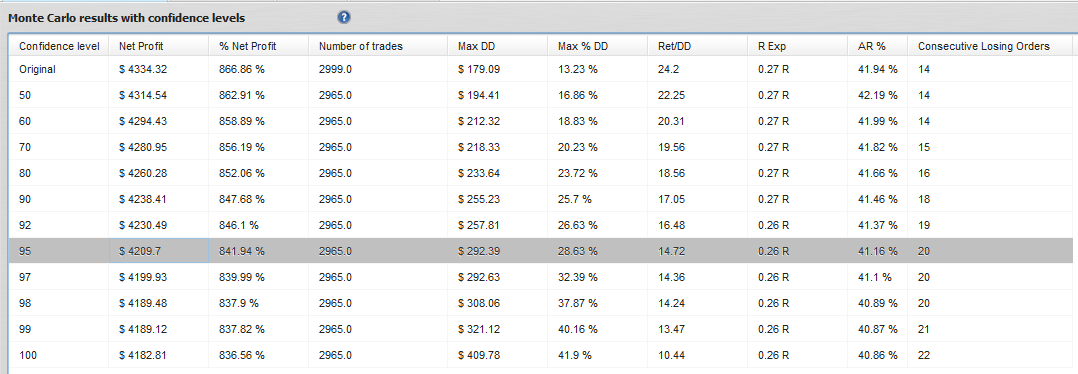
The 95% row (how to read this example)
- Net Profit: about $4,209.7
- Max %DD: about 28.63%
- Ret/DD: 14.72
- Consecutive Losing Orders: about 20
A practical way to size your lot
A simple rule of thumb:
Lot multiplier ≈ Allowed %DD ÷ (Max %DD at 95%)
- Allowed DD = 20% → multiplier ≈ 20 / 28.63 ≈ 0.70x
- Allowed DD = 30% → multiplier ≈ 30 / 28.63 ≈ 1.05x (but beginners should usually stay at or below 1.0x)
Think of Monte Carlo as a tool to build a plan that’s harder to break, not as “proof” that an EA is profitable.
3) The Monte Carlo Chart (Spread of Equity Paths)
The chart overlays many simulated equity paths created by reshuffling.
Don’t focus on the best-looking lines. Focus on the lower (pessimistic) side.
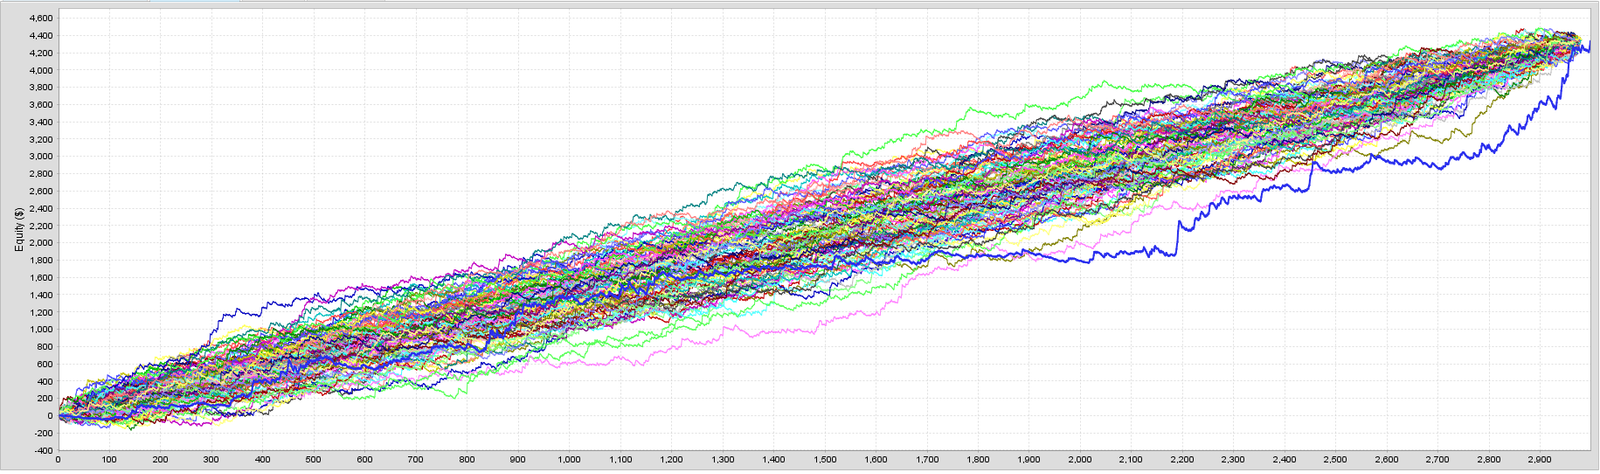
- Even if most paths rise, the pessimistic side can still show a large drop.
- In live trading, set your lot size based on whether you can survive the worst realistic paths.
4) Risk of Ruin: Always Confirm the Assumptions
Risk of Ruin estimates the chance of hitting a defined “failure” threshold.
The most important part is the assumptions behind the calculation (often fixed lot size, specific rules, etc.).
Example (as displayed in this model)
- Initial balance $125 → Risk of Ruin = 3%
- $250 or more → 0% (under these assumptions, it rarely reaches the failure line)
⚠️ Warning: these numbers depend heavily on assumptions like fixed lots.
If you use compounding (variable lot size) or change your broker’s margin/stop-out rules, re-evaluate.
5) Predict/Verify: Use It as a Range, Not a Forecast
Predict/Verify shows a possible range of equity values after a given number of future trades.
Don’t treat it like a crystal ball. Use it as a planning range.
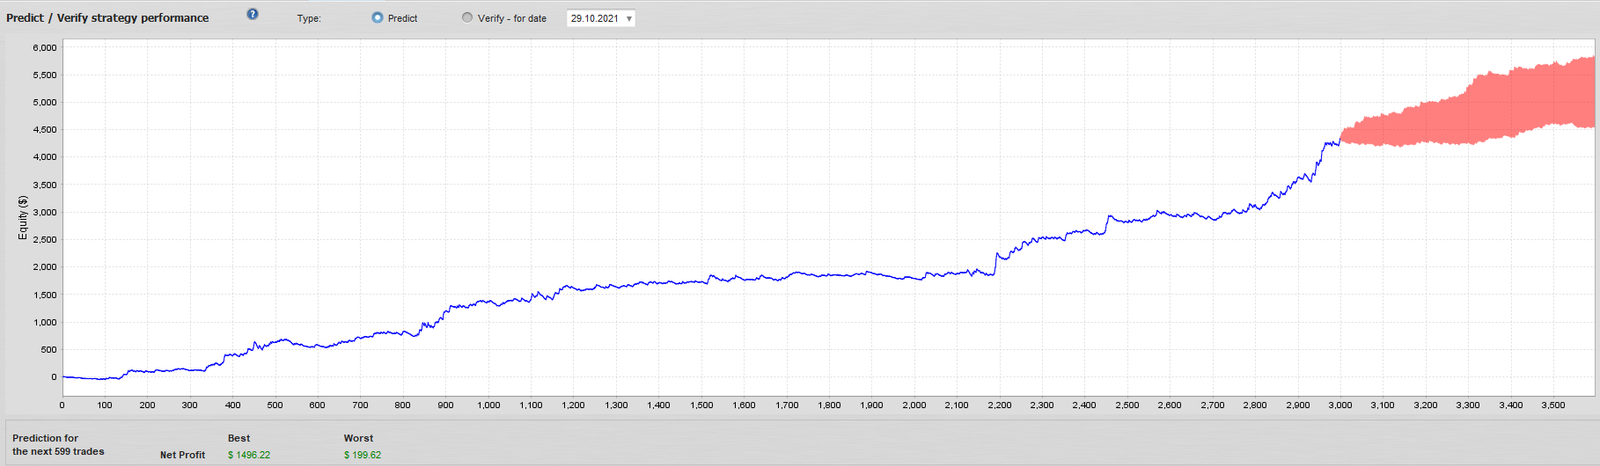
Practical rule
Design withdrawals and “keep running or stop” decisions around the lower band, not the upside. That reduces nasty surprises.
[Example 2] Why a Grid (Averaging-Down) EA Can Look “Safe” in Monte Carlo—A Dangerous Blind Spot
Next, a grid / averaging-down EA.
Grid systems often show a smooth balance curve, but the equity drawdown (floating loss) can temporarily explode.
When you apply Monte Carlo analysis to this type, you can get a situation where the table and chart look great, but the EA is still dangerous.
Equity DD Spikes: The Biggest Risk Monte Carlo Often Misses
In this sample grid EA, even with an initial balance of $10,000 and a fixed lot size of 0.01,
there were periods where equity drawdown reached close to 50%.
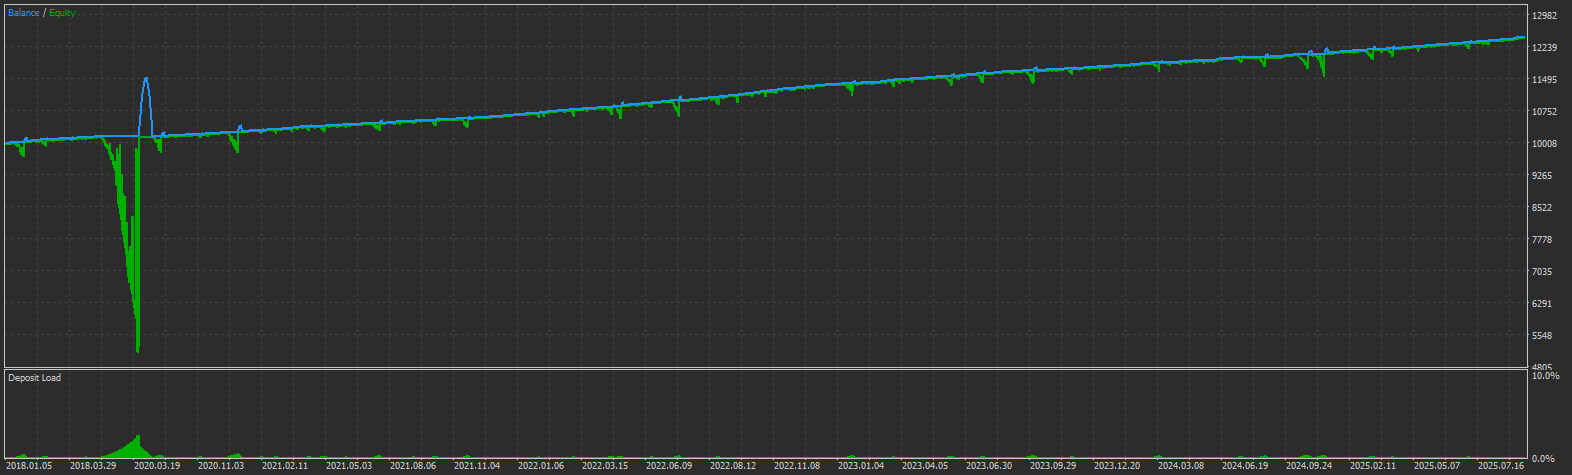
Even when balance looks steady, equity (including floating P/L) can sink deeply. This is the core risk of many grid systems.
Important: Monte Carlo analysis generally reshuffles closed trades.
So the most dangerous grid behavior—“floating loss grows while positions stay open, then price returns (or it doesn’t)”—
often does not show up properly in the Monte Carlo table.
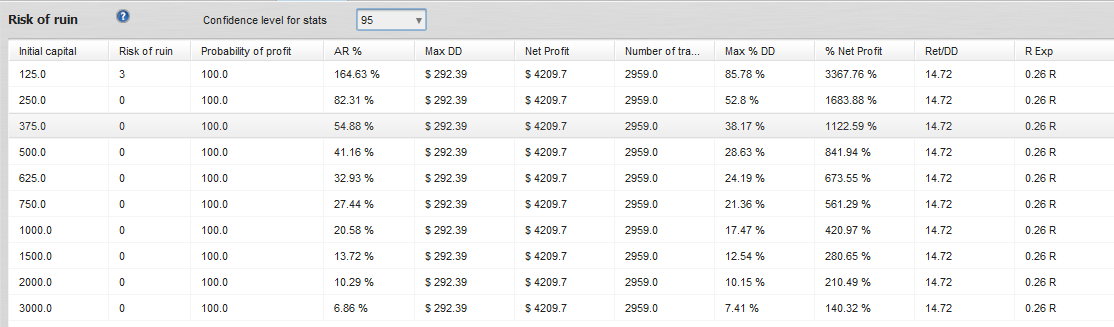
A Case Where Monte Carlo Numbers Look “Safe” (Risk of Ruin and Confidence Table)
With grid systems, the Monte Carlo table can sometimes look like “low DD” and “Risk of Ruin = 0%”.
But here’s the one takeaway that matters:
Don’t call it “safe” based on these numbers alone.
Monte Carlo analysis mainly reshuffles realized (closed-trade) P/L.
But the most common grid failure path comes from equity drawdown and margin pressure—which can remain a separate risk.
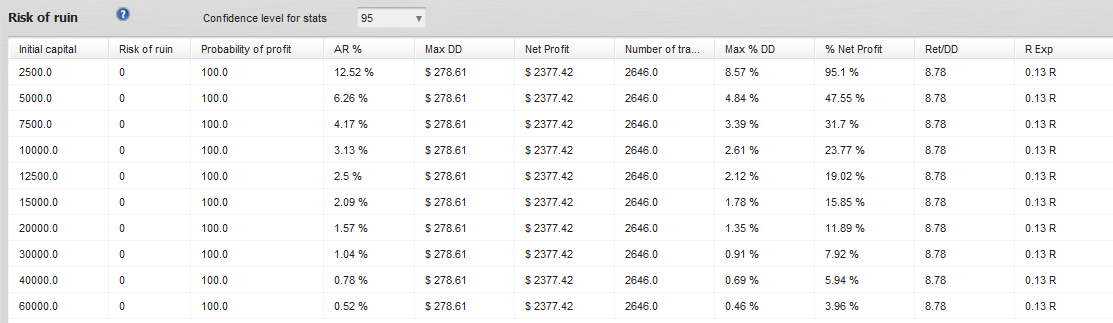
Risk of Ruin at 0% Doesn’t Mean You’re Safe (Concrete Example)
The table below shows an example of Risk of Ruin at 95% confidence. With an initial balance of $10,000, it can show values like:
- Risk of Ruin = 0
- Max %DD = 2.61% (Max DD = $278.61)
- Net Profit = $2,377.42 (% Net Profit = 23.77%)
At a glance, you might think: “Only 2.61% DD and 0% risk of ruin—sounds safe.”
But that’s only in the world of reshuffled closed trades.
It does not guarantee safety against equity DD spikes or broker stop-out rules triggered by margin pressure.
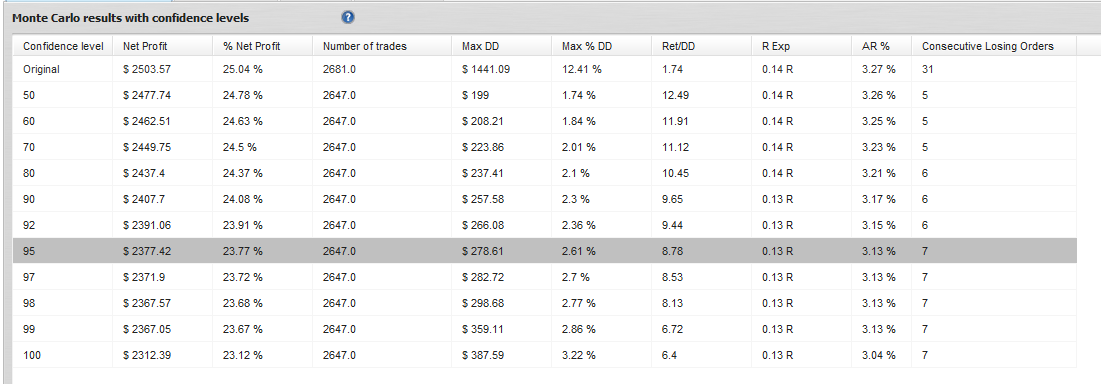
A Small Max %DD at 95% Confidence Still Doesn’t Mean “Safe” (Concrete Example)
Next is the Monte Carlo result by confidence level. Again, the 95% row is often used as a pessimistic benchmark.
In this example, the 95% row shows:
- Net Profit = $2,377.42
- Max %DD = 2.61% (Max DD = $278.61)
- Consecutive Losing Orders = 7
This also looks “very safe.”
But this Max %DD (2.61%) comes from reshuffling realized P/L.
It often fails to reflect the true grid risk: equity DD expansion (floating loss growth).
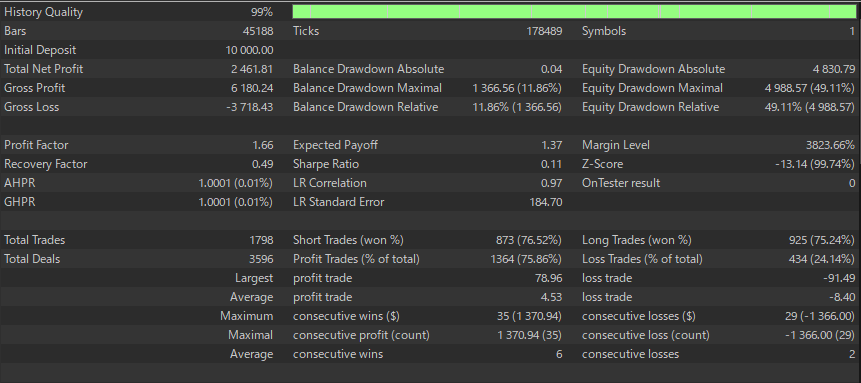
Monte Carlo Shows Low DD, but MT5 Shows Equity DD Near 49% (The Real Problem)
This is the #1 point beginners misunderstand.
Even if the Monte Carlo 95% row shows Max %DD = 2.61%, the MT5 statistics can show equity drawdown on a completely different scale.
In this sample grid EA (initial balance $10,000), MT5 shows:
- Balance DD (relative) = 11.86% ($1,366.56)
- Equity DD (relative) = 49.11% ($4,988.57)
So the Monte Carlo table looks “safe” with 2.61% DD, while the real backtest shows a period where equity dropped by about half.
As long as this gap exists, Risk of Ruin = 0% is not enough to call it safe.
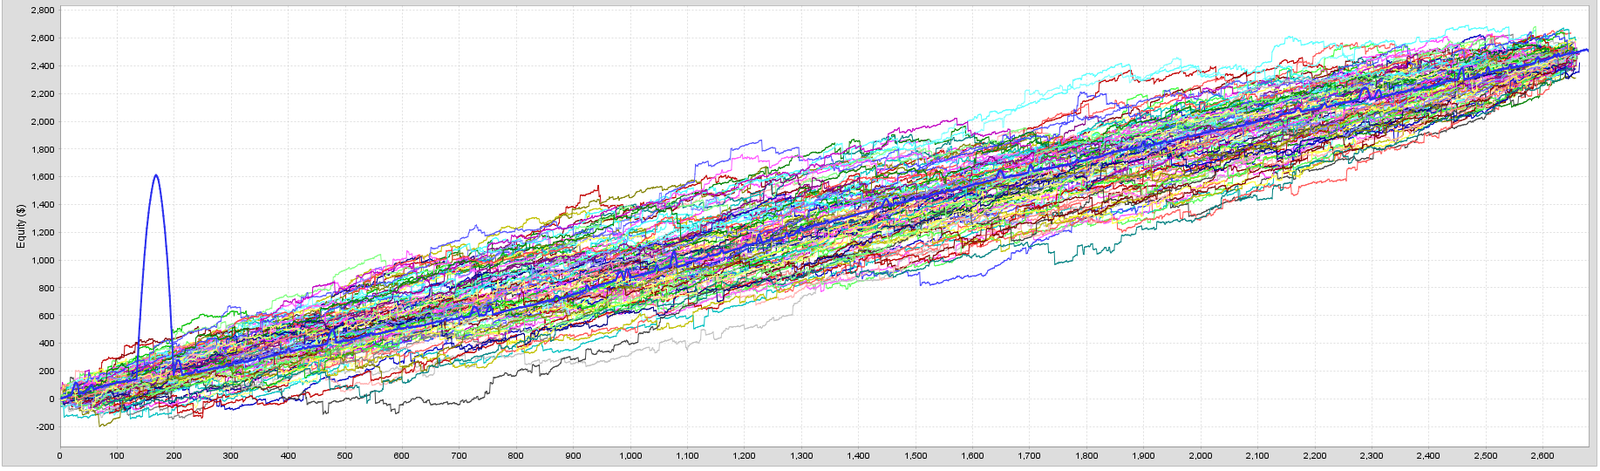
A Smooth Monte Carlo Chart Still Doesn’t Mean Safe (You Need Other Metrics)
Monte Carlo charts can look stable because many paths overlap and the curves look “clean.”
But for grid systems, even a beautiful chart can’t remove the risk of equity drawdown and margin-based forced exits.
Summary: Why You Shouldn’t Call It “Safe” from These Numbers
- Risk of Ruin = 0% and Max %DD = 2.61% often come from a closed-trade (realized P/L) view
- Grid failures often happen via Equity DD and margin pressure (this example shows Equity DD ≈ 49%)
- So even if the Monte Carlo table looks good, you can’t judge safety from it alone
Minimum checklist to review together
Max Equity DD / maximum open positions / margin usage (free margin, margin level) / stop-out rules / MAE (maximum adverse excursion / worst floating loss)
Why It Looks “Good” (Two Beginner Traps)
Monte Carlo results for grid systems and “many small wins, occasional big loss” systems can look impressive:
- The curve looks smooth and steadily rising
- Max %DD looks low (so it feels safe)
But these risks often fall out of the table:
- Equity drawdown spikes (MAE / floating loss): hard to see until trades close
- Margin risk: required margin and stop-out rules often decide survival
- Loss clustering: when price trends one way, pain can stack quickly
Conclusion: With grid / martingale EAs, don’t judge safety from a Monte Carlo screenshot.
At minimum, review Max Equity DD, margin level, max open positions, and stop-out rules together.
Limits of Monte Carlo Analysis and What to Do Instead (How “Safe-Looking” EAs Fool You)
Monte Carlo analysis is a useful method to estimate the variation in closed-trade outcomes by reshuffling trade sequences.
But it is not万能. For some EA types, it can fail to measure the most important risks.
Especially important:
If an EA survives by holding floating losses (grid / averaging down) or if it has a low risk-reward profile (many small gains, occasional large losses),
Monte Carlo analysis alone cannot evaluate blow-up risk properly.
The reason is simple: Monte Carlo mainly uses closed-trade results.
1) Unrealized Loss (Equity DD) Often Doesn’t Show Up Properly
Most Monte Carlo analysis resamples closed-trade P/L (balance-based).
So it struggles to capture these live-trading dangers:
- Equity DD spikes (floating loss growth)
- Margin pressure (falling margin level)
- Margin calls / stop-outs
What to do (minimum actions)
- Check equity-based risk metrics separately (Max Equity DD, MAE, margin usage)
- In backtests, confirm max open positions, worst floating loss, and worst margin conditions
- Define clear stop rules (max DD, max positions, margin thresholds)
2) Not Great for Compounding (Variable Lot Size)
Many Monte Carlo tools assume fixed lot sizes.
If your lot size changes with balance (compounding, fixed-risk-% rules), simple reshuffling can fail to reproduce future risk accurately.
What to do
- Test compounding directly in your EA backtester (with your actual sizing rules)
- If needed, resimulate using percentage returns and apply compounding afterward (note: assumptions heavily affect results)
3) Long-Term Price Scale Changes Can Distort Results
Over long backtests, price levels can change significantly.
If your system uses fixed pip stops/targets or fixed grid spacing, the “meaning” of the same pip value can change across decades, which can distort evaluation.
What to do
- Normalize using percentage or ATR-based volatility multiples instead of fixed pips
- Split long tests into multiple periods and confirm the strategy doesn’t rely on one specific era
4) Simple Shuffling Breaks Streak Patterns (Autocorrelation)
Simple reshuffling breaks real-world patterns like clusters of losing streaks and regime-driven bias.
That can make drawdowns look milder than what you might experience.
What to do
- Consider block bootstrapping (e.g., resample blocks of 5–20 trades)
- Combine with tests split by market regimes (trend vs range, high vol vs low vol)
Summary: Monte Carlo analysis is great for understanding closed-trade variation.
But for grid / averaging-down systems and low risk-reward EAs, it cannot measure blow-up risk on its own.
Always review Equity DD, margin metrics, and MAE together—and include stop rules and monitoring in your final decision.
Common Misunderstandings and Warnings (The “Looks Safe” Trap)
Monte Carlo analysis is helpful, but reading it the wrong way can lead you to pick an EA that only looks safe.
Here are the most common mistakes beginners make.
Misunderstanding #1: A Smooth Monte Carlo Band = A Safe EA
Bottom line: A smooth chart does not automatically mean low risk.
For grid / martingale systems in particular, realized P/L can look stable while equity DD and margin risk grow fast in live trading.
Since Monte Carlo mainly uses closed trades, it can underestimate those risks.
- What to focus on: the equity curve (account equity), not just balance
- Must-check items: Max Equity DD / margin usage (Free Margin, Margin Level) / MAE
- High-risk designs: “hold through floating loss,” and “many small wins, rare big losses”
Misunderstanding #2: A Monte Carlo Screenshot = Reliable Proof
Bottom line: Screenshots can be used as “authority dressing.”
Monte Carlo tables look professional. Some vendors place them on sales pages to create a sense of safety.
But if the assumptions aren’t clear (fixed lots, closed-trade-only, etc.), the results can be made to look better than they are.
Judge credibility using this set:
- Forward testing (live account if possible, or at least long-term)
- Strategy robustness (does it hold up when conditions change?)
- Proof it avoids overfitting (OOS tests, walk-forward, parameter sensitivity)
- No heavy reliance on grid/martingale (if it does rely on them, equity + margin validation becomes mandatory)
Monte Carlo analysis isn’t something to “trust because it exists.”
You need to understand its assumptions and blind spots—and use it as one tool among several.
Conclusion: Monte Carlo Analysis Is a Money-Management Tool, Not a Safety Certificate
Monte Carlo analysis helps you visualize the variation of closed-trade results (Max DD, losing streaks, profit range),
and it can be a valuable tool for choosing position size and required capital.
But it has blind spots:
- Equity DD (floating loss): the real danger in grid/averaging-down systems often doesn’t show up clearly
- Compounding (variable lot size): fixed-lot assumptions can create a mismatch
- Long-term price scale changes: fixed-pip assumptions can distort evaluation
Don’t rely on Monte Carlo analysis alone.
What matters most is strategy robustness and an operating plan that avoids forced exits when conditions change.
Use forward testing and OOS validation, avoid curve-fitting (over-optimization), and confirm whether the EA relies on grid/martingale behavior.
If it does, demand clear evidence for equity and margin safety (not just a Monte Carlo screenshot).
Related: What Is EA Robustness? How to Choose “Hard-to-Break” EAs and a Pre-Purchase Checklist
Frequently Asked Questions (FAQ)
- 1) Compared with a single backtest, what does Monte Carlo analysis measure?
- A backtest is only one historical path—one curve. Monte Carlo analysis resamples closed-trade results to generate many alternative paths, then checks the distribution of max drawdown, final P/L, losing streaks, and risk of ruin. It helps you visualize worst-case ranges, but it does not replace forward testing or OOS validation.
- 2) Which confidence level should I use, and how do I decide lot size from it?
- Many traders use the more pessimistic 95% confidence level (lower band). A practical guideline is: Lot multiplier ≈ Allowed %DD ÷ Max %DD (95%). For example, if Max %DD (95%) is 28.63% and your allowed DD is 20%, the multiplier becomes about 20 / 28.63 ≈ 0.70x.
- 3) Does Monte Carlo analysis account for unrealized loss (Equity DD) or margin calls?
- In most standard setups, no. Monte Carlo analysis typically uses closed trades only, so it can miss large equity drawdowns, margin usage, and exposure—especially in grid/averaging-down or martingale systems. Check Max Equity DD, MAE, and margin metrics separately, and also confirm your broker’s stop-out rules.
- 4) Can I use Monte Carlo results for compounding (variable lot sizing)?
- Use caution. Many Monte Carlo tools assume fixed lot sizes. If your lot size changes with balance or a fixed-risk-% rule, simple reshuffling can misstate risk. Practical alternatives include resimulating with percentage returns and applying compounding afterward (assumption-sensitive), or validating compounding directly in the EA backtester using your real sizing rules.
- 5) How should I read “Risk of Ruin”?
- Risk of Ruin estimates the probability of reaching a defined failure threshold under the model’s assumptions. It tends to be most meaningful when lot size is fixed. Even if it shows 0%, don’t blindly trust it if you change lot rules, leverage, or margin/stop-out conditions—recalculate and re-check under the new assumptions.
- 6) Why can grid/averaging-down or martingale EAs look “safe” in Monte Carlo analysis?
- Because resampling closed trades can ignore large floating losses and margin concentration while making the equity path look smoother. That’s why Max %DD may look small even when live trading risk remains high. For grid/martingale systems, always validate the equity curve, floating DD, margin metrics, and the broker’s stop-out level—alongside Monte Carlo tables.
- 7) How much data do I need for a meaningful Monte Carlo analysis?
- More trades across more market regimes (trend, range, high vol, low vol) increases reliability. As a rule of thumb, aim for hundreds of trades or more. If streak clustering and market regimes matter, consider block bootstrapping (e.g., resampling blocks of 5–20 trades) and regime-separated testing.