Can averaging-down (grid) EAs really make money?

In the short term, it’s easy to make them look like they’re “winning.”
But over the long run, floating losses can pile up, and the strategy can head straight to a margin call (forced liquidation) and a blown account.
Beginners are especially likely to be fooled by a grid (averaging-down) EA’s smooth profit curve, jump in, and then learn the hard way.
In this article, I’ll explain how the system works using screenshots and MT5 backtests with a sample EA I built myself.

Are Grid EAs Dangerous? Why They Look “Always Up” and How They Blow Up Accounts
Grid EAs (averaging-down EAs) often look incredibly clean in the short term.
That’s because they can keep taking small profits on minor pullbacks even while holding losing positions (floating losses).
But that “up-only” curve is not proof of safety.
In many cases, losing positions are quietly building under the surface, and the floating loss keeps growing little by little.
Then when the market moves strongly in one direction (a major trend), floating losses can expand fast and trigger a margin call (forced liquidation), which can wipe out the account.
In other words, even if the curve looks perfect short term, it can still be a strategy that breaks in the long run when the “big move” eventually shows up.
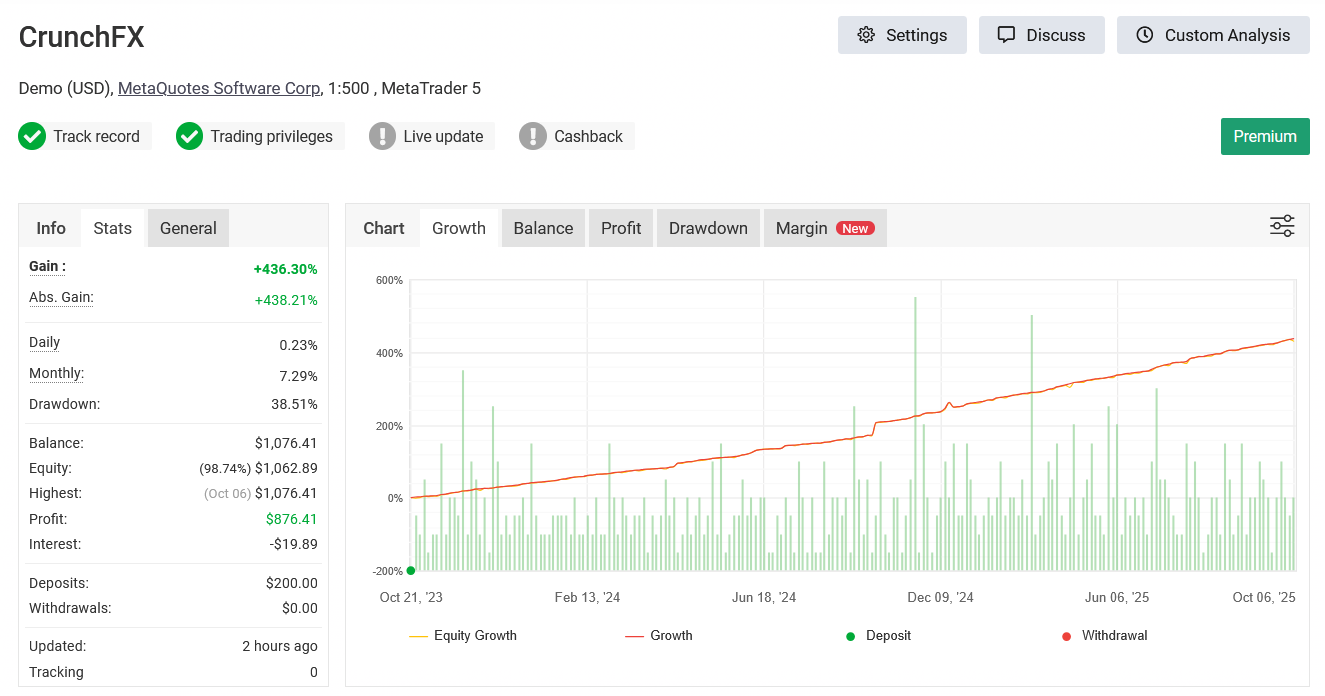
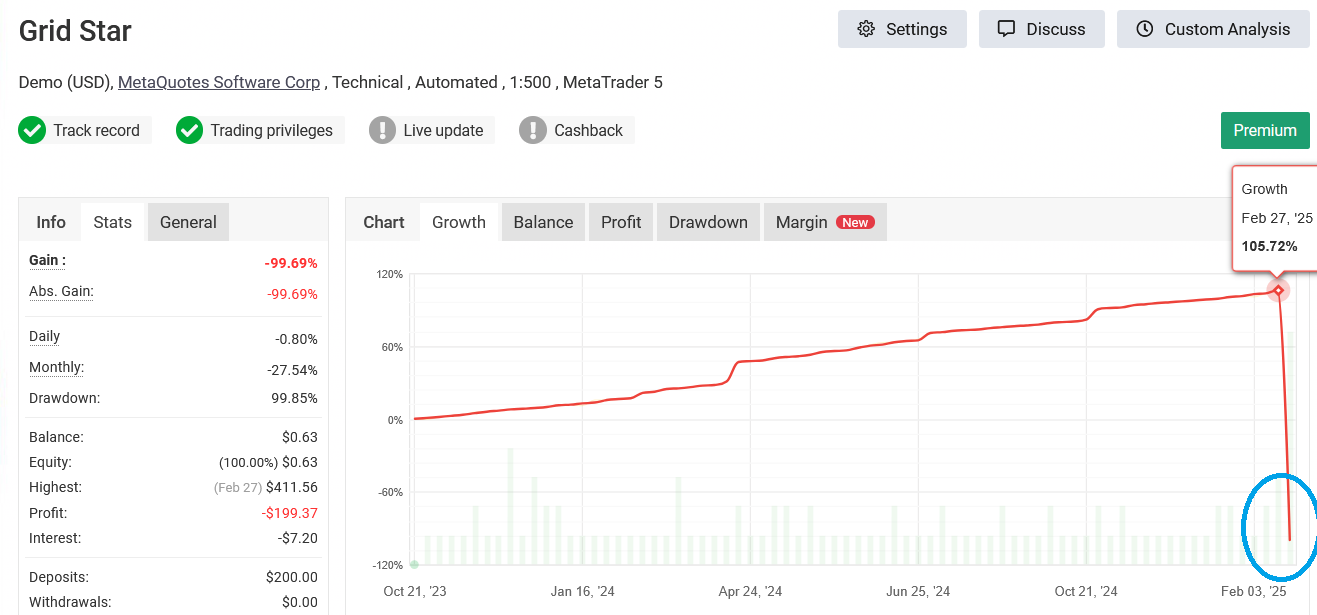
As in the examples below, a curve that starts out beautiful can suddenly drop to zero at some point—so don’t get tricked by the early results.
How a Grid EA Works: Small Profits in Ranges, but Fragile in Trends
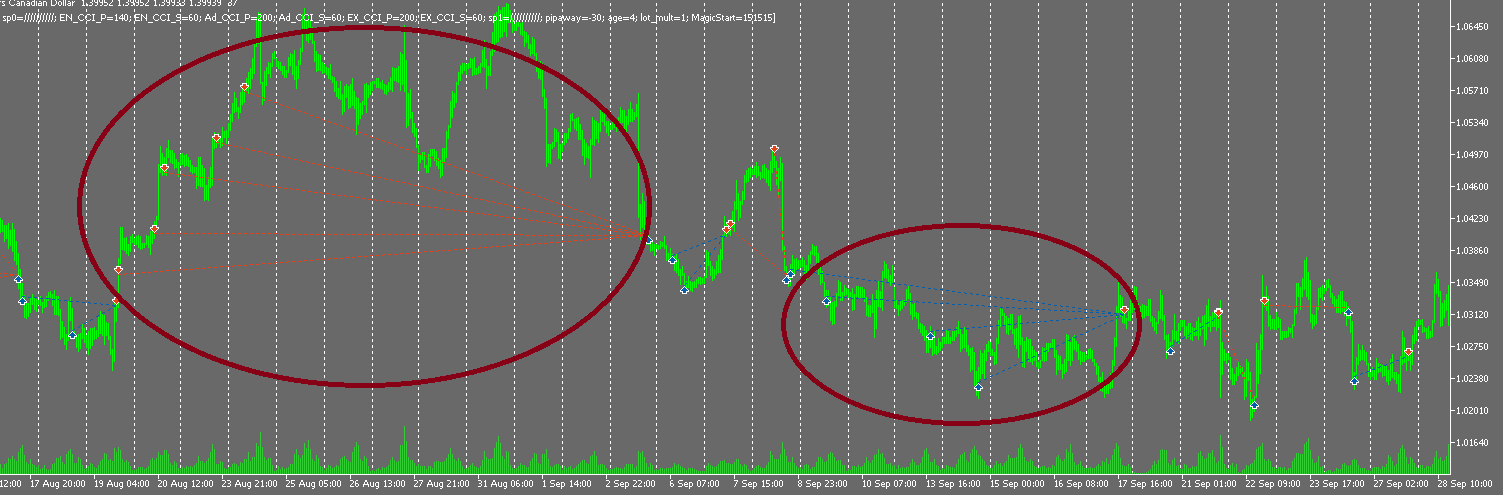
A grid EA places orders at fixed intervals (a “grid”) and tries to collect small profits from price moving back and forth.
In a ranging (sideways) market, this can win often, and the balance curve (realized profit/loss) tends to look like a smooth climb.
But the weakness shows up when the market trends strongly in one direction.
Positions on the wrong side can keep adding like a snowball, and the floating loss (unrealized loss) can grow quickly.
When margin can’t withstand it, the account can hit a margin call (forced liquidation).
Why the Profit Curve Looks “Too Smooth” in the Short Term
- Many grid EAs are designed to “hold and wait” rather than cut losses. As long as the market keeps making small back-and-forth moves, they can keep locking in small take-profits, so short-term results often look clean.
- Floating losses show up in equity, but they can be easy to miss if you only look at the HTML backtest report. That delays risk awareness.
- The strategy assumes “price will come back.” When it doesn’t, one strong trend can wipe out a long time of small gains in a single hit.
Adding Martingale Makes the Blow-Up Risk Even Worse
If you combine a grid with martingale (increasing lot size as price moves against you), results can look even more impressive.
A small bounce can produce a large profit, so the curve looks flashier and “more profitable.”
But the downside is brutal: if price keeps going the wrong way, floating losses can explode and the time to a blown account becomes much shorter.
Related article: Martingale EAs: Why They Blow Up (Backtest Proof + Checklist)
“No Martingale = Safe” Is a Myth
Even without increasing lot size, a pure grid can still create large losses.
To exit in profit, it often needs a bigger pullback, so positions can get stuck for a long time (bag-holding).
During that time, spreads and swaps (holding costs) add up, your margin stays tied up, and the stress builds.
When market conditions change, it can still slide into the same blow-up path—so don’t assume “no martingale” means “safe.”
Case Study (Tested with a Self-Made Sample EA): Results Change Drastically by Time Period and Symbol
From here, I’m not using marketing data from EA sellers.
I’m using a sample grid EA I built myself and checking its behavior with MT5 backtests.
The point is not to declare “grid EAs win” or “grid EAs lose.”
The point is to make it easy for beginners to see when and how grid EAs tend to break.
Test settings (baseline): USDCAD / M5, contrarian CCI entry + fixed-interval grid, leverage 1:500, starting balance $1,000, fixed lot 0.01.
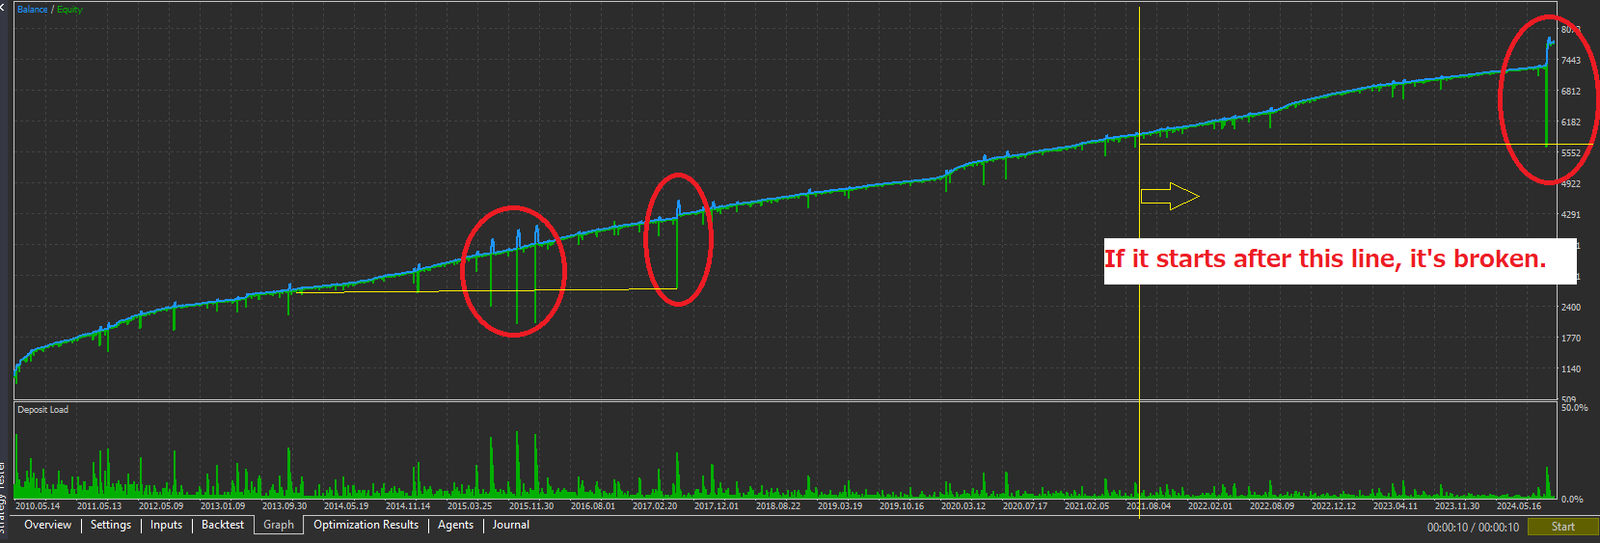
2010–2025: It Looks “Up-Only,” but It Carries Hidden Floating-Loss Risk
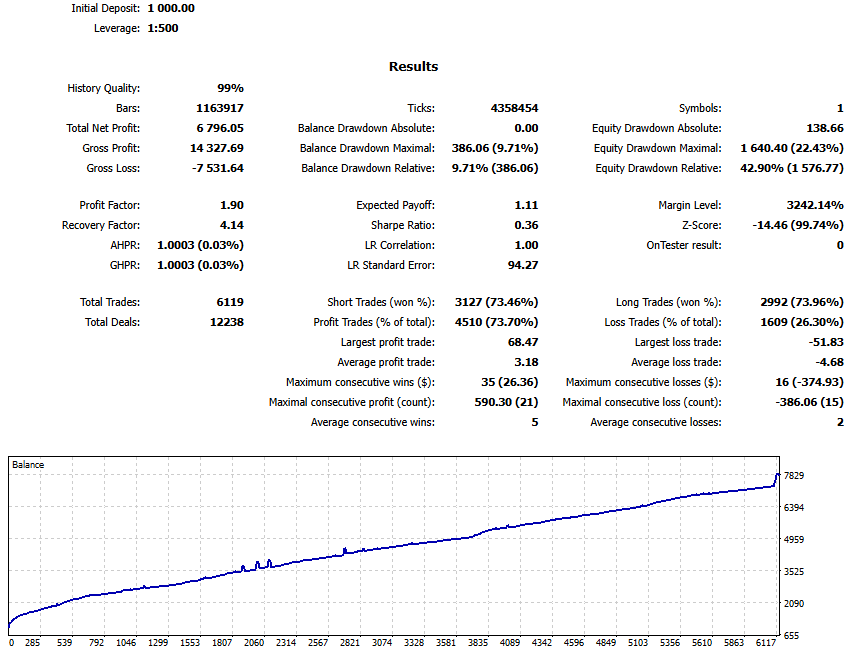
- The balance curve rises, profit factor is around 1.9, and win rate is over 70%—it looks “strong.”
- But the equity drawdown is about 43%. That shows the EA was carrying large floating losses under the surface.
- This “up-only” curve is closer to apparent stability created by waiting for pullbacks and postponing losses.
2023–2025: Same Settings, but Changing the Period Alone Can Cause a “Straight-Down” Blow-Up
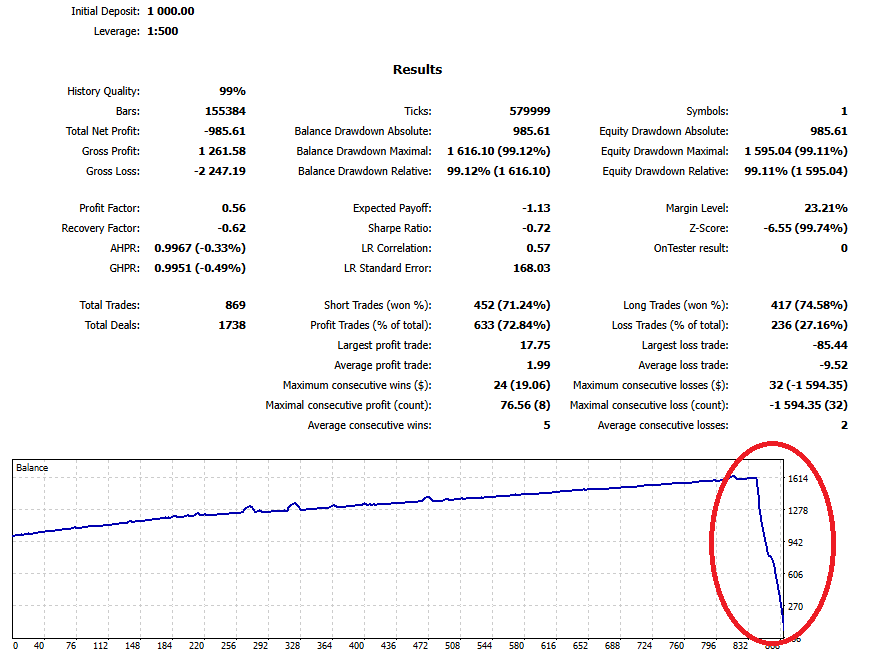
- The settings are identical. But simply changing the period caused a strong trend to wipe out the account and drop the balance to zero.
- This shows that “how long it survives” can depend heavily on when you start. If the early market phase goes against you, it can fail quickly.
- Starting in 2010 gave time for the balance to grow and build a buffer. Starting in 2023 didn’t have that buffer, so it couldn’t survive the same kind of move.
- That’s why you shouldn’t assume you can reproduce a seller’s forward test results on your own account.
Important: The HTML Backtest Report Can Hide Equity Risk—Check the MT5 Terminal Graph
MT5’s HTML backtest report can make equity (account value including floating P/L) hard to judge.
If you backtest yourself, always open the terminal graph and check whether balance and equity diverge, and whether equity drops sharply.
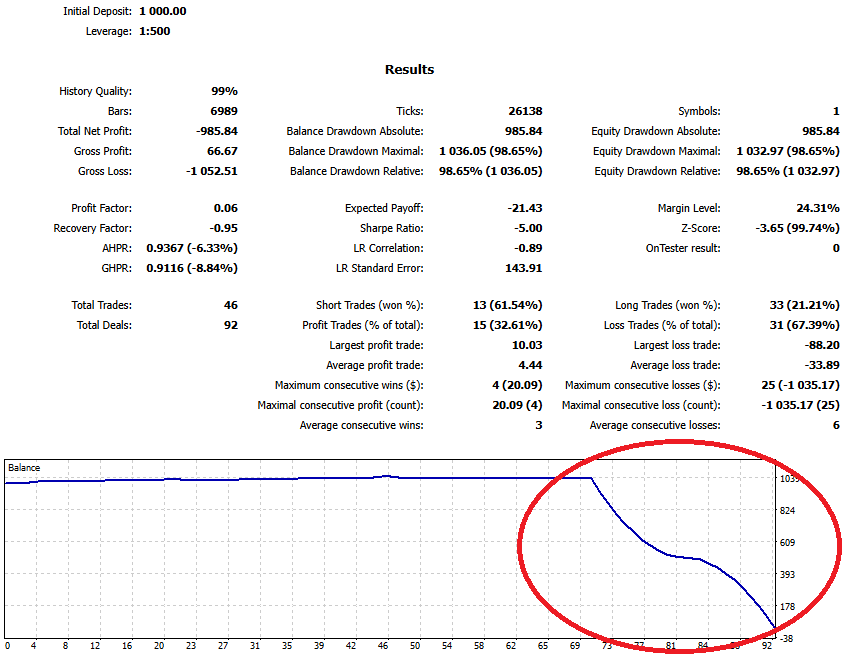
Just Switching Symbols Can “Instantly Blow It Up”: A Classic Sign of Overfitting
I then tested the exact same settings that looked “clean” on USDCAD (2010–2025) on EURUSD.
Even with a $1,000 balance and a fixed 0.01 lot size, it dropped to near zero almost instantly.
This suggests the setup was tuned to USDCAD’s historical data (overfitting / curve-fitting), and may not work once the symbol changes.
Related: EA Overfitting (Over-Optimization): How to Detect It Before You Buy
Small Accounts Are High Risk: Grid EAs Blow Up More Easily with Low Balance
With grid EAs, survival often depends less on “win rate” and more on account balance.
The reason is simple: when floating loss expands, you need enough free margin to withstand it.
For example, even with a small fixed lot like 0.01, a strong one-way move can still create an equity drawdown on the order of $2,000.
If that happens early, a $1,000 account can hit a margin call (forced liquidation) very quickly.
Yes, a larger balance can “extend survival” because it gives more buffer.
But here’s the trap: a grid EA can keep stacking floating loss in markets that don’t revert.
So even a large balance doesn’t make it “guaranteed safe.”
The risk of a sudden wipeout on a big trend or shock move is always there.
Why Low Leverage Can Be Risky: “Low Leverage = Safe” Doesn’t Always Apply to Grid EAs
- Grid EAs often survive by relying on high leverage + margin buffer. With lower leverage, margin requirements are heavier, so the same adverse move can break your margin level sooner and trigger stop-out earlier.
- In low-leverage conditions, bag-holding can lock up funds for a long time and reduce free margin, leaving you less room to act.
- In normal trading, low leverage is usually safer—but with grid logic, the core risk structure doesn’t change. Lower leverage can simply make the “dead end” arrive sooner.
Related: High Leverage for Forex EAs: The Real Risk Is Lot Size (Margin + Safety Rules)
Grid EAs and Compounding (Auto Lot Sizing): A Bad Match
One of the attractions of FX is compounding—adjusting lot size as your balance grows while keeping a fixed risk % per trade.
If it works well, your account can scale efficiently.
But grid EAs often clash with that idea.
Because grid EAs tend to carry floating losses and rely heavily on the balance-to-lot relationship, raising lot size can bring the blow-up point closer.
In practice, many traders prioritize survival and keep lot size fixed instead of compounding.
That means grid EAs are generally not suitable for “growing an account through compounding”—they often force you into fixed-lot damage control, which kills the compounding advantage.
Related: EA Lot Size & Position Sizing: Fixed vs Auto Lot, Risk % Rules, and Starting Deposit Math
Warning: Common Sales Tricks for Grid EAs—It’s Easy to Make Them Look Like They’re Winning
Those “beautiful up-only” results on sales pages are tempting.
But are they real skill—or just the grid structure making it easy to look good?
Because grid EAs can look strong in the short term, dishonest sellers often exploit that.
Here are common presentation tricks to watch out for:
Short-term forward tests often look great (but that doesn’t prove skill)
- Many grid EAs avoid cutting losses or cut very slowly. They can keep collecting small profits on pullbacks, so short-term balance curves often look like a straight line upward.
- Floating loss (equity drawdown) is easy to hide. If you only show the balance curve, it can look “safe” even when it’s not.
- Sales pages may cherry-pick a “good window” and make it look like the good moment will last forever.
Related: How to Read Myfxbook: Spot Risky EAs (Balance vs Equity, Margin Spikes, Trade History)
Survivorship bias: “many forward accounts” can hide the failures
- If someone runs many similar grid accounts, some will survive by chance just because market conditions happened to fit.
- Sellers often show only the survivors. The blown accounts and failures disappear—so the displayed results are not proof of real edge.
The “it looks safer because the balance grew” illusion (balance-dependent trick)
- A surviving account has already grown, so it can tolerate bigger adverse moves and drawdown may look smaller.
- That can create a “good-looking loop”: balance grows → looks safer → balance grows more. But one tail-risk move can still erase everything.
How to Spot a Grid (Averaging-Down) EA: A Beginner-Friendly Checklist
Grid EAs often get sold under different labels, so they can be hard for beginners to identify.
But if you check a few key points, you can spot them with a high success rate.
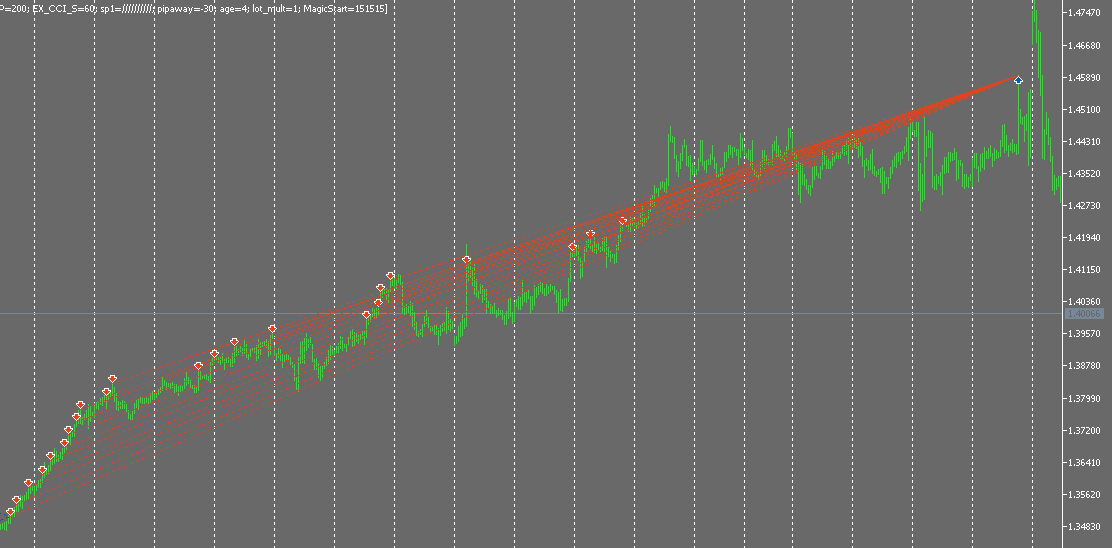
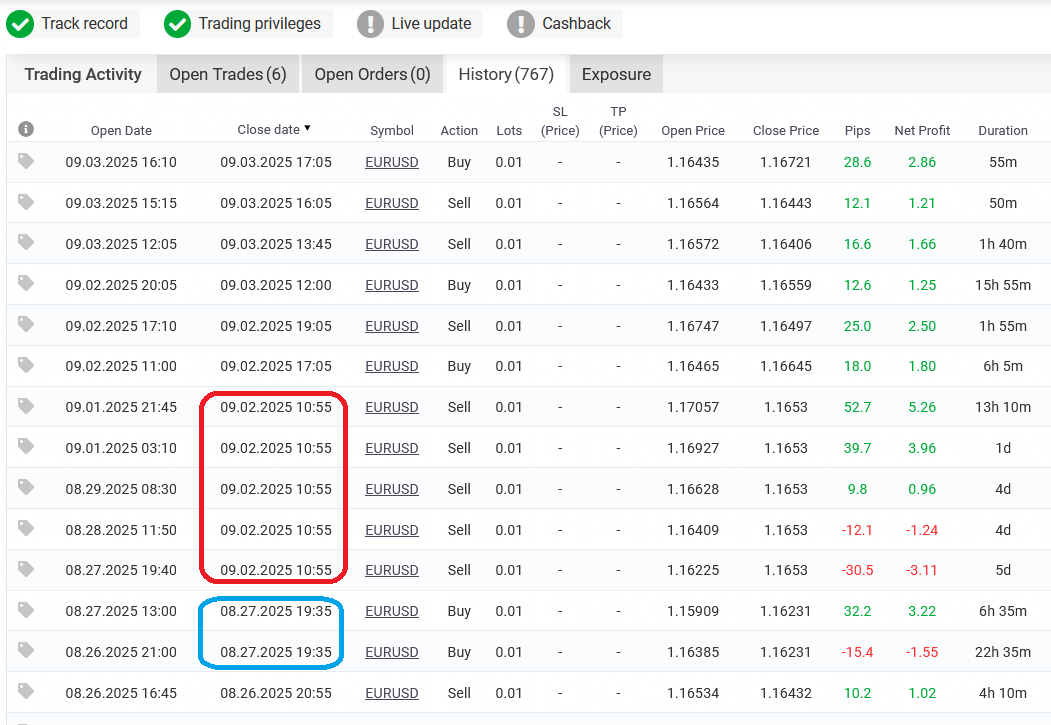
Start with the trade history (most reliable)
- In backtests/forward tests, do you see many positions closing at the exact same time? That often signals a basket close.
- When price goes against the trade, do positions in the same direction get added repeatedly? That’s classic averaging-down behavior.
- If trade history or floating-loss/equity data is hidden, be cautious. It may be hiding the ugly part.
Check the sales page “requirements” and wording
- It requires high leverage (e.g., 1:100+) and recommends a very large balance (thousands to tens of thousands of dollars).
- It uses terms like Grid / Mesh / Levels / Step / Averaging / Recovery / Zone / Basket / No SL.
- It says things like “no stop loss,” “it always comes back,” “Recovery mode,” or “AI optimizes averaging down.”
- It highlights “too perfect” metrics: near-zero drawdown, extremely high win rate in a short period, etc.
Look for clues in the input parameters (settings screen)
- Parameters like
GridStep / Distance / Levels / MaxOrders / BasketTP / Profit in Moneyoften point to grid/basket logic. Multiplier > 1or “Recovery” often suggests martingale or recovery-style risk.- No StopLoss, an unrealistically wide StopLoss, or “basket close only” is a major red flag.
Final check: behavior in backtests (don’t get fooled by the balance curve)
- Even if balance is rising, does equity diverge heavily or drop sharply?
- In a one-way trend, do orders increase step-by-step, followed by one big batch close?
- Do you see extremely long holding times (bag-holding) plus heavy swap costs (holding costs)?
Related: How to Read MT5 Backtests: Verify EA Risk with Equity DD & Orders/Deals
What to Choose Instead: How to Pick Safer, More Robust EAs (Beginner-Friendly)
Grid EAs can look great short term but still carry a high risk of a sudden wipeout, depending on the market.
If your priority is protecting capital, choose EAs designed to survive rather than EAs designed to look flashy.
- A realistic StopLoss (SL) is always in place
- If the EA can exit at a predefined loss, the loss is limited.
- If SL is missing or extremely wide, it can fail badly when the market doesn’t revert.
- It focuses on risk-reward (RR), not just win rate
- A rough target is RR ≥ 1.5–2.0 (average win larger than average loss).
- A high win rate can still be dangerous if one loss wipes out many small wins.
- See also: Stop Chasing Win Rate: How to Evaluate Forex EAs with Expectancy, Risk-Reward & Drawdown
- Fixed risk per trade (e.g., 0.5%–1% of the account)
- Limiting the maximum loss per trade helps avoid “one-hit kill” events.
- Auto lot sizing based on balance and risk % can reduce catastrophic risk compared to open-ended averaging down.
- Not overfitted (robust across symbols and periods)
- Check whether it holds up when you change symbols, time periods, or brokers.
- If it’s “amazing” only in one specific condition, it may be curve-fitted.
- Positive expectancy by design
- Expectancy (E) = Win rate × Average win − (1 − Win rate) × Average loss
- Confirm E stays positive using both backtests and forward tests.
Summary: Why Grid (Averaging-Down) EAs Are Risky and Often Blow Up Over the Long Run
Grid EAs can look smooth in the short term, but structurally they’re the kind of strategy that can break when the “one big move” eventually arrives.
If your goal is to protect capital, it’s usually best to avoid them.
Remember these four points:
- Losses are hard to cap (many designs cut losses slowly or not at all, so floating loss can become fatal)
- They rely on “it will come back”, so strong trends or shock moves can wipe them out quickly
- Win rate and profit factor can look artificially strong (one blow-up can erase months of gains)
- They don’t mix well with compounding (increasing lot size often increases the speed of a blow-up)
Finally, if you’re unsure when picking an EA, prioritize these two checks:
(1) Does it cap losses with a realistic SL? and (2) Is risk per trade fixed?
Even just these two can greatly reduce the chance of getting wiped out in one hit.
Related: EA Robustness Explained: How to Choose a Forex Trading Robot That Won’t Blow Up
FAQ
- Q. If the balance curve looks smooth, can I assume the EA is safe?
- A. No. Grid EAs can keep collecting small profits while carrying floating losses, so the balance curve often looks clean. Don’t judge by balance alone—check equity drawdown and the gap between balance and equity.
- Q. Will lowering leverage make a grid EA safer?
- A. Often it does the opposite. With lower leverage, margin requirements are heavier, so the same adverse move can break your margin level sooner and trigger stop-out earlier. That’s why “low leverage = safe” doesn’t always apply to grid EAs.
- Q. Is a grid EA okay if it doesn’t use martingale (no lot increase)?
- A. It may reduce the risk a bit, but the core problem remains. Even with fixed lots, the strategy can keep holding losses while waiting for a pullback. In a non-reverting market, that can still lead to long bag-holding, margin lock-up, and forced liquidation.
- Q. If an EA recommends a large balance and high leverage, does that mean it’s “professional”?
- A. Not necessarily. Grid EAs often look “more stable” with a bigger balance because the account has more buffer. What matters more than the recommended balance is how losses are capped (SL, max positions, exit rules, etc.).
- Q. If the forward test has been up-only for 6–12 months, can I trust it?
- A. Not by itself. Grid EAs can look great in certain market conditions and break when conditions change. Treat forward tests as reference only, and check equity drawdown disclosure, full trade history transparency, and worst-case risk together.
- Q. Is an HTML backtest report enough to judge risk?
- A. Sometimes it isn’t. Even if the report numbers and balance curve look good, floating-loss risk can be easy to miss. If possible, view the backtest with balance and equity together and check for divergence and sharp equity drops.
- Q. So what kind of EA should I choose instead?
- A. Beginners should start with these conditions: (1) a realistic SL that caps losses, (2) fixed risk per trade (e.g., 0.5%–1%), (3) decent RR (roughly 1.5–2.0+), and (4) robustness across symbols and periods (not overfitted). The more boxes it checks, the higher the chance it survives long term.