EA Overview
| Logic Overview | Machine Learning |
|---|---|
| Martingale | No |
| Grid | No |
| Scalping | Yes |
| Trading Pairs | XAUUSD |
| Timeframes | 1M |

Forward Performance Analysis (MQL5 Signal) (As of Jan 14, 2026)
In this section, I summarize the current forward performance of Goldwave EA MT5 based on the publicly available data from the MQL5 signal
(GoldWave signal / Shengzu Zhong). This is not a guarantee of future results—this review reflects only what can be confirmed today.
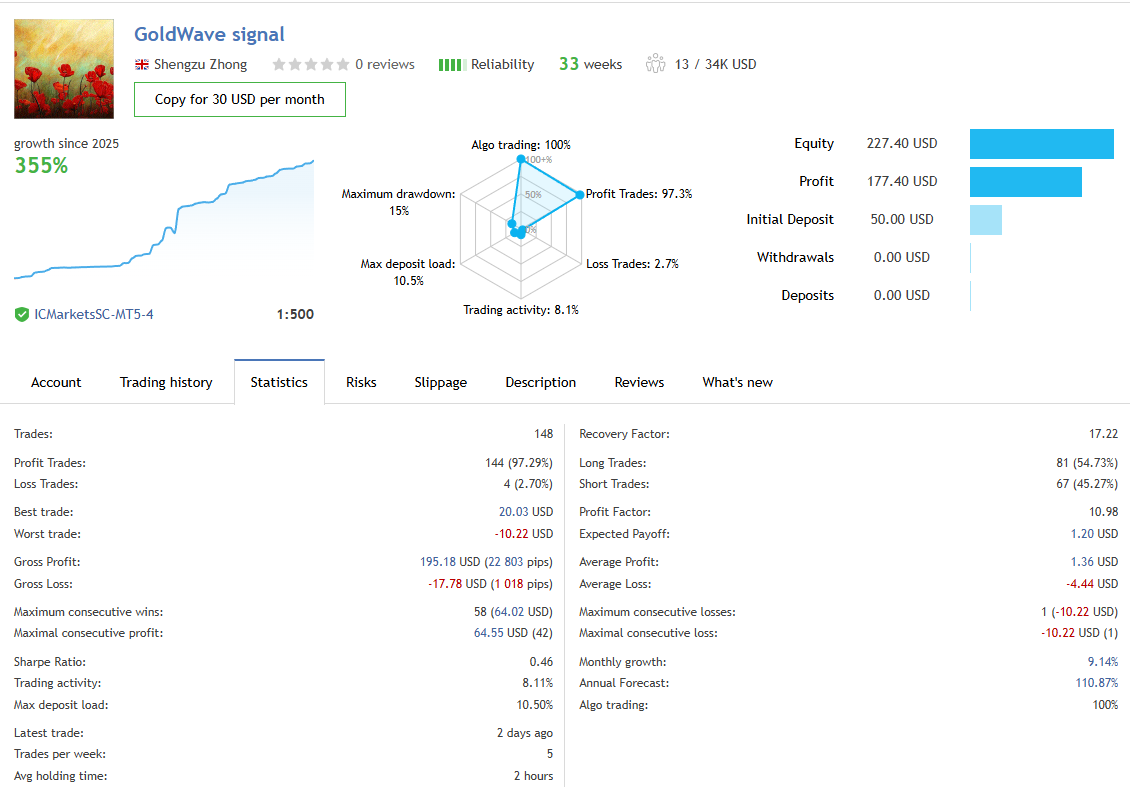
Signal Overview (Key Figures as of Today)
Key metrics visible in the MQL5 signal statistics are:
- Track record: 33 weeks (still not “long-term”)
- Trades: 148 (already over 100 executions)
- Win rate: 97.29% (Profit trades 144 / Loss trades 4)
- Growth: 355% (shown as “growth since 2025”)
- Max drawdown: 15%
- Leverage: 1:500, Initial deposit: $50
Time Period & Sample Size: What It Proves—and What It Doesn’t
The forward track record appears to have started around May 2025, and at 33 weeks / 148 trades it provides more than just a “few weeks” of data.
That said, to judge whether the EA can survive real market risks—regime shifts, volatility spikes, spread widening, and slippage—you would ideally want
one year or more of forward performance.
Main Caution: Unfavorable Risk-Reward Behind the High Win Rate
Despite the extremely high win rate, the statistics indicate an important weakness:
the average loss is larger than the average profit.
Specifically, the average profit is roughly +1.36 USD while the average loss is about -4.44 USD.
In other words, this is not “small loss, big win,” but rather a structure of “many small wins and heavier losses.”
With this type of profile, stop-losses tend to be delayed (or losses are held longer), which naturally pushes the win rate higher and can make
short-term forward performance look impressive. However, when conditions turn unfavorable or a sudden move hits, a small number of losses can erase a large portion of gains and damage the curve.
The better the headline numbers look, the more important it becomes to keep watching the forward performance over time.
Possible Mismatch vs. the Backtest Discussed Later
A key part of EA evaluation is consistency between forward behavior and backtest behavior under comparable conditions.
For this EA, there are signs that its forward behavior may be meaningfully different from what the backtest suggests.
In general, when forward results are strong but backtests do not reproduce the same stability, common suspects include
execution dependence (broker/slippage differences), market regime bias, or external factors such as filters or discretionary-like logic.
Because this EA shows an exceptionally high win rate, it’s even more important to focus on how it loses, not just how often it wins.
Quick Takeaway (As of Today)
It is a positive sign that a public MQL5 signal exists and that we can observe 100+ real trades.
However, the forward data already reflects unfavorable risk-reward, so “high win rate” should not be mistaken for safety.
Given that strong short-term performance can be expected with delayed losses, the safer approach is to judge it while monitoring how it behaves through drawdown phases.
Backtest Results Analysis (As of Jan 14, 2026)
In this section, I summarize the behavior of Goldwave EA MT5 based on a backtest I personally ran in MetaTrader 5 (Strategy Tester).
This is not a guarantee of future results—these findings reflect only what I was able to reproduce as of today.
Backtest Setup (My Test Conditions)
- Period: Jan 1, 2005 – Jan 10, 2026 (about 20 years)
- Symbol: XAUUSD
- Initial deposit: 10,000 USD
- Lot size: Fixed 0.01 lot
- Other settings: Default
- Spread: 60 points
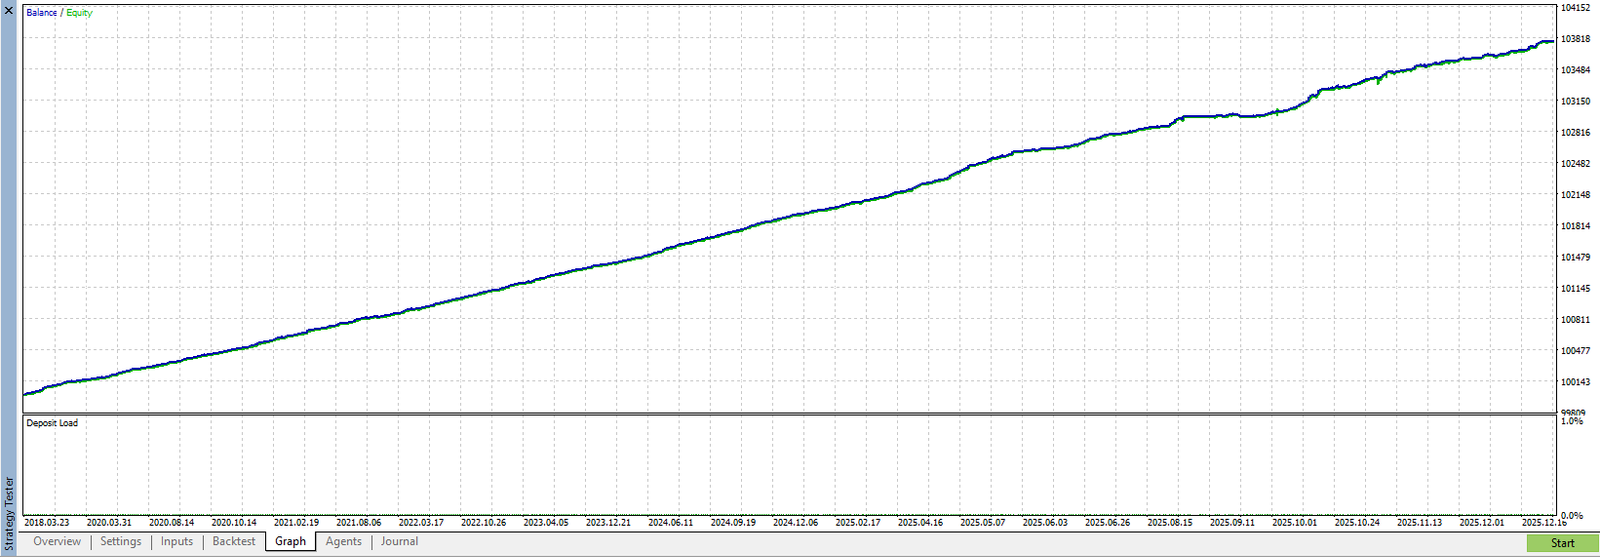
Equity Curve: “Too Perfect” and Unusually Smooth
Both the balance and equity curves formed an extremely smooth upward trend with minimal steps.
Visually, it looks very attractive—almost “too perfect.”
But the key point is that a beautiful curve does not automatically mean safety.
Backtests can benefit from idealized fills and reduced slippage, and in this case the EA did not trade across the whole 2005–2026 window,
so it is risky to treat this curve alone as evidence of long-term robustness.
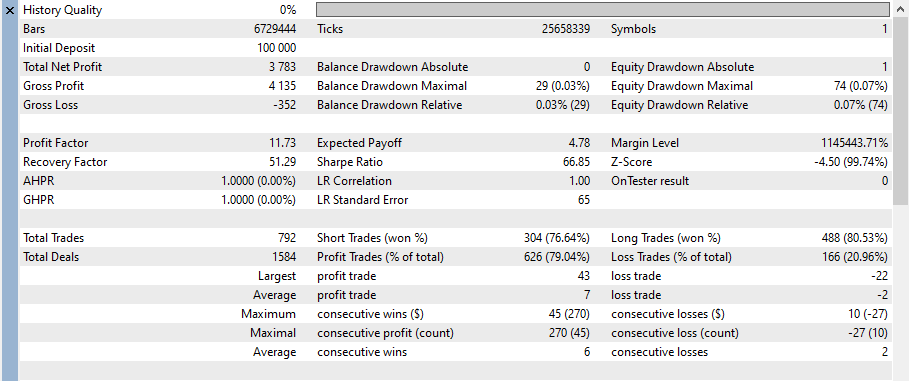
Drawdown: Evaluate in Absolute USD, Not Percent
Drawdown percentages can easily shift depending on the account balance and lot sizing, which makes comparisons unstable.
For that reason, I evaluate drawdown here in absolute USD terms under a fixed-lot (0.01) assumption.
Under this setup, the maximum equity drawdown (absolute) was about 74 USD, which looks very small in the backtest
(under the same conditions and environment used in my test).
Risk-Reward Looks Better in the Backtest—But Forward Behavior May Differ
In the backtest, profits and losses appeared relatively balanced, and the risk-reward does not look bad on paper.
However, in the forward MQL5 signal, stop-losses appear slower and the average loss exceeds the average profit.
This gap matters. It suggests that the EA may be running with different settings in forward trading, or that broker conditions and external filters
are changing its behavior. In other words, it is not safe to assume “good backtest = same forward performance.”
Big Red Flag: Trading Starts Only After 2018
Even though the backtest window begins in 2005, the chart shows that actual trading starts only after 2018.
That means the EA’s performance in earlier market conditions cannot be evaluated at all.
Possible explanations include:
- Backtest participation is intentionally restricted by conditions
- The strategy is designed to trade only within specific price/volatility regimes
- The filters are so strict that it simply “doesn’t trade” for large portions of history
Regardless of the reason, presenting it as a “20-year test” can be misleading when it effectively becomes a post-2018 test.
This is a point that should be clearly highlighted in any review.
Small Average P/L: Clear Scalping Characteristics
The statistics show that both average profit and average loss per trade are very small, indicating a strategy that targets small price moves—i.e., scalping.
Scalping EAs are strongly affected by spread, commissions, and execution quality.
Even if a backtest looks great, real trading can diverge significantly—especially when forward results already show signs of slower stop-loss behavior and unfavorable risk-reward.
Quick Summary: What the Backtest Can—and Cannot—Tell You
- What it suggests: The backtest curve is very smooth, and the maximum equity drawdown (absolute) looks small under fixed 0.01 lots.
- What it cannot prove: Performance before 2018 cannot be evaluated, and forward behavior may differ, so safety cannot be concluded from the backtest alone.
Trading Logic & Risk Profile
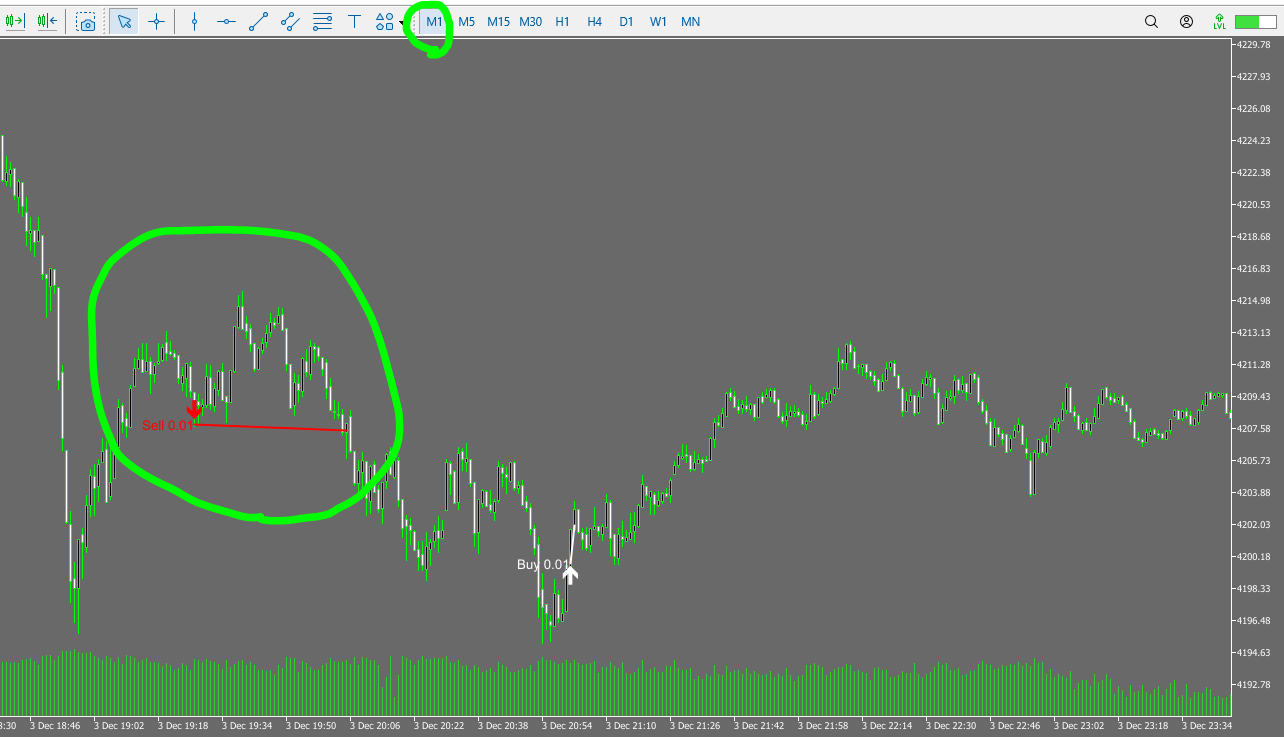
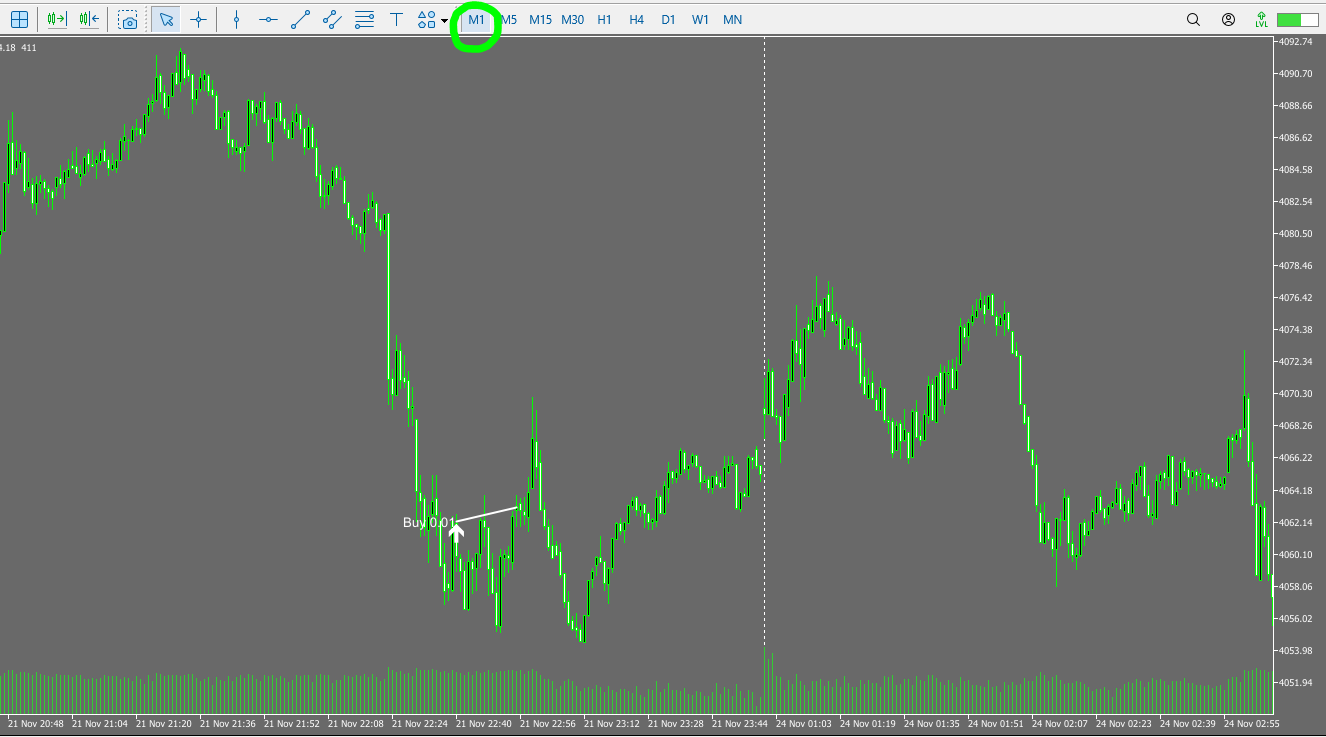
This section summarizes (1) what the developer claims about the strategy and (2) what can be inferred from the forward trade-history chart
(white = Buy, red = Sell). In short, it appears to be a scalping-style EA that depends heavily on execution conditions,
and the forward results suggest small profits with slower stop-loss behavior, so continued monitoring is essential.
Developer’s Description (Organized Summary)
- It evaluates trend quality and risk conditions and avoids trading when the environment is unfavorable
- It claims to avoid hazardous methods such as grid and martingale (a positive point)
- It does not rely on forcing average price adjustments via multiple stacking positions, according to the description
- It mentions external filters (e.g., news) or auxiliary logic, which may be one reason behavior differs between backtests and live trading
What the Forward Trade-History Chart Suggests
The plotted trade history (white = Buy, red = Sell) indicates a profile consistent with scalping small price moves.
Because scalping is sensitive to spread, slippage, and server latency, results can vary significantly depending on the broker and execution environment.
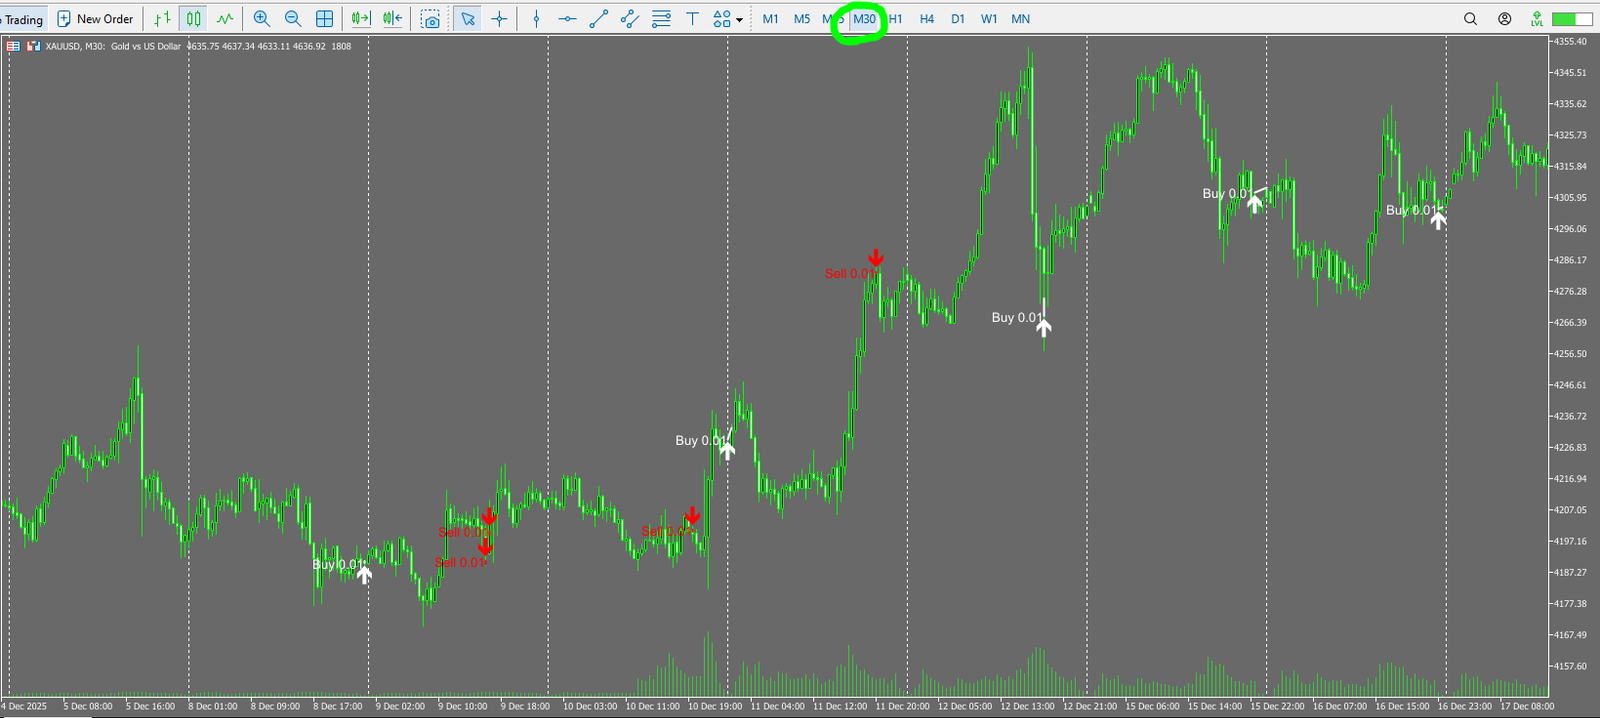
Key Caution: “Small Take-Profit, Slow Stop-Loss” in Forward Trading
The biggest concern in the forward behavior is that profits are small while losing positions appear to be held longer when price moves against the trade.
With this structure, delaying stop-losses can push the win rate higher and make short-term performance look strong,
but a rare large adverse move can break the curve.
Why Backtest and Forward Can Become “Different Strategies”
In the backtest section, risk-reward looked relatively balanced. In the forward signal, the profile looks closer to “many small wins, occasional heavier losses.”
This gap suggests differences in configuration (default vs. forward settings), broker conditions, or external filters.
Risk Summary (Key Points to Watch)
- The “no grid/martingale” claim is a plus, but forward behavior may involve slow stop-loss dynamics.
- As a scalping EA, performance can change significantly with spread, slippage, and execution quality.
- A high win rate can look better in the short term if losses are delayed—so do not judge it by short-term forward results.
- The most important ongoing check is how it loses: loss size, frequency, and behavior during adverse regimes.
Overall Verdict & Summary
Based on the forward MQL5 signal data available today and my own backtest results, here is the overall assessment of Goldwave EA MT5
(GoldWave signal / Shengzu Zhong).
Conclusion
The current numbers look attractive. However, because (1) the forward results can look “too good” in the short term with delayed losses and (2) the backtest and forward behavior appear to diverge,
this EA should be evaluated with caution.
What Looks Positive
- A public MQL5 signal exists, allowing third-party monitoring of live performance.
- The forward history includes 100+ real trades, providing a minimum sample beyond “a few trades.”
- The developer claims to avoid grid/martingale, which is a positive structural point.
- In the backtest, the curve looks very smooth and the drawdown (absolute) appears small under fixed 0.01 lots.
Key Risks & Red Flags
- In the forward data, risk-reward looks unfavorable (small profits with potentially slow stop-loss behavior).
This is a common pattern where short-term results can look stronger than they are. - The EA’s behavior may be different between backtests and forward trading, suggesting configuration/environment or external-filter effects.
- Although the backtest window starts in 2005, trading activity is concentrated after 2018, so earlier performance is a black box.
- As a scalping-style EA, results are highly dependent on spread, slippage, and execution quality, and real-world performance may differ materially.
How to Interpret It (As of Today)
- Do not judge by the headline curve—ongoing forward monitoring is essential.
- Focus less on win rate and more on loss behavior (loss size, frequency, and regime sensitivity).
- Do not overtrust the backtest, since trading is concentrated after 2018 and long-term robustness remains unknown.
Overall, Goldwave EA MT5 currently looks strong on the surface, but it may also be a strategy that can look better in the short term than it will over the long term.
Treat it as an EA that requires careful, ongoing verification rather than immediate conclusions.
The developer claims there is no grid or martingale, which is a positive. However, the forward results suggest small wins with slower stop-loss behavior, meaning a few losing trades could break the equity curve.