EA Overview
| Martingale | Yes |
|---|---|
| Grid | No |
| Scalping | No |
| Trading Pairs | XAUUSD |
| Timeframes | 1M |
| Developer | Alno Markets Ltd(Gregory Hay) |

Forward Test Analysis (as of December 2025)
More Than +1,300% in About Two Years – But the Risk Structure Matters
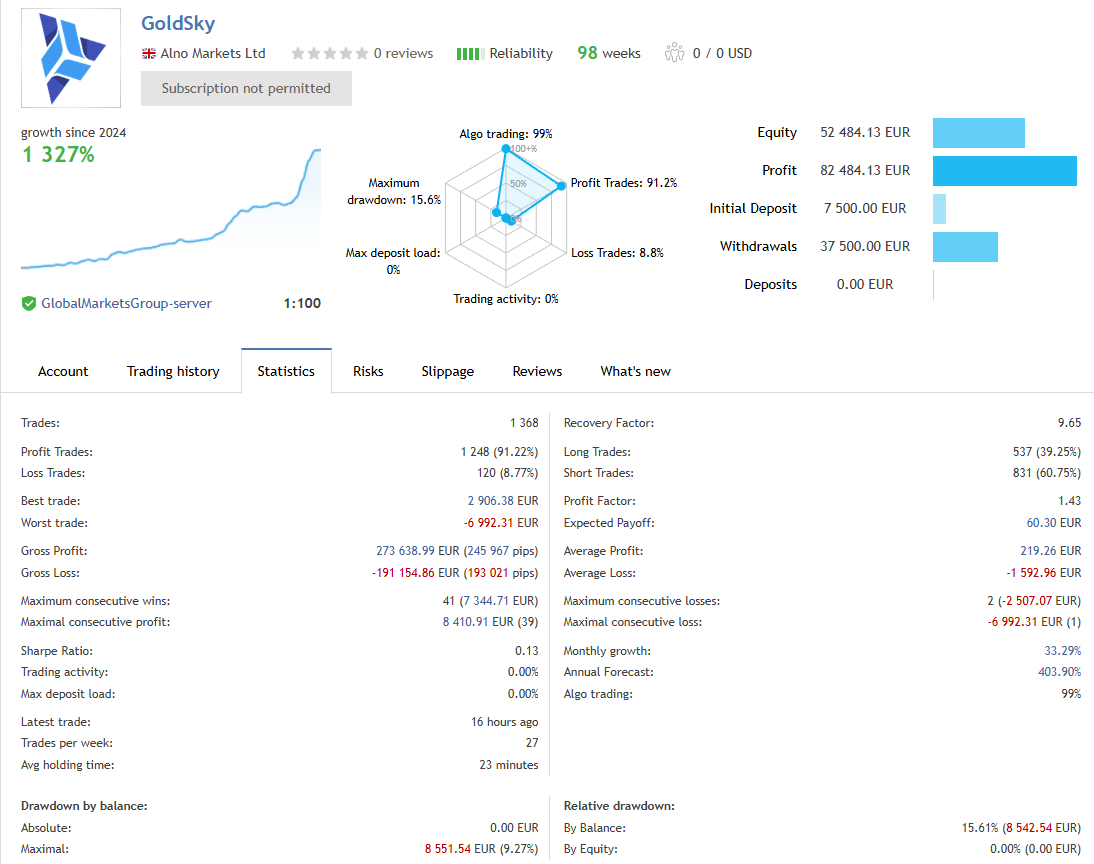
As of the time of writing (December 2025), GoldSky has been running as a forward signal on MQL5 for about 98 weeks. The initial deposit was 7,500 EUR, with total profit of roughly 82,484 EUR and a growth rate of +1,327%, which is an impressively strong result in purely numerical terms. Since a total of 37,500 EUR has been withdrawn along the way, the current account balance is around 52,484 EUR.
Looking at the balance curve, there have been no major collapses so far. There are some periods of consolidation and pullbacks, but overall the equity has trended steadily upward. However, as discussed below, this performance is partially achieved by combining a very high win rate with martingale-style lot control, so there is more risk hidden under the surface than the smooth equity curve alone might suggest.
Win Rate Above 90% and Large Average Losses
According to the statistics, out of a total of 1,368 trades, 1,248 trades were winners (91.22%) and 120 were losers (8.77%), which is an exceptionally high win rate for a forward test. On the other hand, the average profit is about +219 EUR, while the average loss is about -1,593 EUR, meaning that a single loss is equivalent to more than seven winning trades.
The best trade is +2,906 EUR, and the worst trade is -6,992 EUR. This clearly shows that the EA is a “small frequent wins, occasional large loss” type system. The profit factor is 1.43, which is not extraordinarily high, but combined with a high win rate and high trade frequency, it has been enough to generate substantial overall profit so far.
Martingale-Style Behavior: Quadrupling the Lot Size After a Loss
Although the EA is often described on the surface as “not using grid or martingale,” the forward behavior strongly suggests that it is designed to try to recover losses by quadrupling the lot size right after a losing trade. It is not as extreme as a full classic martingale, but in the sense that it increases lot size after a loss, it clearly shares the same risk profile as a martingale EA.
This style of lot control can boost the account quickly when losing streaks are short, especially when combined with a very high win rate. However, if you encounter a longer-than-expected losing streak or sudden large price swings, this can be a major driver of deep drawdowns. Although the maximum drawdown so far has stayed around 15%, when you factor in the martingale-style behavior, there is no guarantee that future drawdowns will remain at the same level.
Drawdowns and Trading Style Evaluation
The maximum balance drawdown stands at 15.61% (around 8,542 EUR), with a recovery factor of 9.65, which can be considered quite good “so far,” including the speed at which the account has recovered from drawdowns. However, as mentioned above, the presence of quad-size lots after losses means that there is no assurance future drawdowns will stay in the same range, and it is also reasonable to interpret the past as “we have simply not yet seen the EA hit a truly adverse sequence.”
The EA trades about 27 times per week on average, with an average holding time of 23 minutes, making it close to a short-term day trading or scalping style on the M1 chart. It generally does not hold positions overnight, and the algorithmic trading rate is 99%, so it is essentially run as a fully automated system. The short trade duration and current forward results make the EA look appealing, but given that it is a “high-win-rate EA that increases lot size in martingale style after losses,” it is important to decide in advance how much drawdown you are personally prepared to tolerate before using it.
The above is what can be observed from GoldSky’s forward test as of December 2025. In the following sections, we dig deeper into whether these results are sustainable by examining the backtest data and the internal trading logic.
Backtest Analysis
20-Year Backtest Conditions for Independent Verification
To go beyond the developer’s published information and see how the EA actually behaves, I ran my own MT5 backtest. The test conditions were as follows:
- Period: 1 January 2005 to 28 November 2025 (about 20 years of data)
- Symbol: XAUUSD (gold)
- Initial deposit: 10,000 USD
- Lot size: fixed 0.01 lots in the tester settings (lots increase after losses)
- All other parameters: default settings
- Spread: 60 points (somewhat conservative/wide)
By using a deliberately wide spread and a long 20-year period, the goal was to check “how consistently the EA can remain profitable” and “what magnitude of drawdown can occur” under conservative conditions.
About 3,100 USD Net Profit in 20 Years and a Gentle Equity Curve
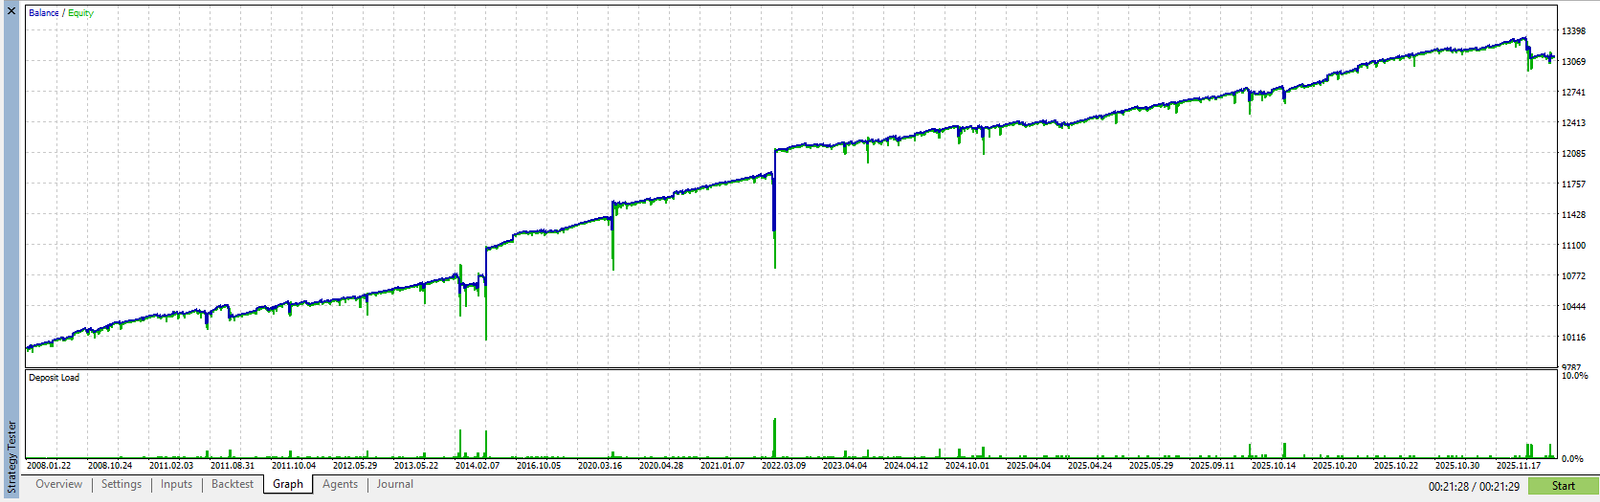
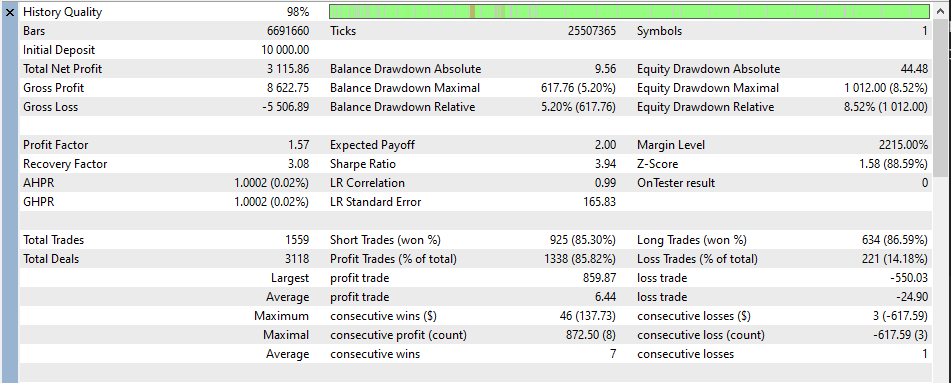
The backtest produced total net profit of around 3,115 USD on an initial 10,000 USD deposit. The equity curve shows several drawdown phases, but overall it gently slopes upward. Since the EA does not hold a large number of positions at once, there are relatively few episodes of outright equity collapse; it mostly behaves as a system that “gradually accumulates profit over time.”
In the statistics, total trades were 1,559, with win rates of roughly 85% on short trades and 86% on long trades, which is similarly high compared to the forward results. The profit factor was 1.57, which indicates that the EA accumulates profit by combining a high win rate with a relatively large number of trades.
Drawdowns of Around 1,000 USD – Evaluated in Absolute Terms
Instead of looking at drawdown as a percentage of the balance, we can evaluate the risk in absolute dollars: the maximum equity drawdown was about 1,012 USD. In other words, there were times when the account was carrying an unrealized loss of around 1,000 USD on a 10,000 USD starting balance.
This means that, as long as you do not increase the lot size too aggressively, such drawdowns are unlikely to be instantly fatal to the account—but you still need to be prepared for swings on the order of a thousand dollars. Because gold can move sharply in a very short time, especially during news events or sudden volatility spikes, there is always a chance of seeing drawdowns similar to or larger than this.
Lot Increases Are “Martingale-Style” – But Not Full Martingale
Looking more closely at the trade history, even though the tester settings specify a fixed 0.01 lot, actual trade volumes vary from 0.01 to around 0.25 lots. This shows that the internal money management logic increases lot size stepwise after losses, in an attempt to recover part of the drawdown with larger positions—that is, it uses martingale-style behavior.
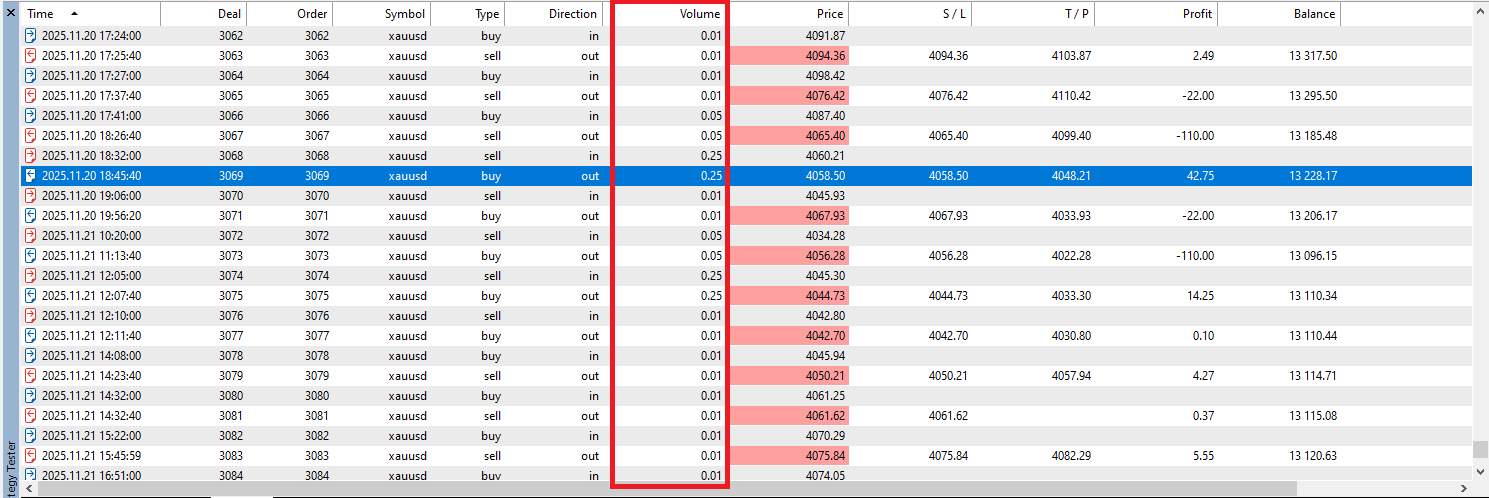
That said, this is not a classic martingale where the lot size doubles after each loss to fully recover all previous losses in one trade. The lot size increases in stages, and the goal is not to recoup 100% of previous losses in a single trade; rather, it is a milder form that “tries to speed up recovery by increasing lot size after losses.”
Nonetheless, the very idea of “increasing lot size after losing” naturally raises risk. If you hit a losing streak or a period where market conditions are not favorable for the strategy, the enlarged lots can result in consecutive stop-losses. In such cases, you might see several trades in a row each losing a few hundred dollars, which is exactly the kind of scenario reflected in the roughly 1,000 USD maximum drawdown mentioned earlier—these are drawdowns that occur during sequences where lot size has already been increased.
What the Backtest Suggests About Expectation and Acceptable Risk
In summary, the 20-year backtest result of about 3,100 USD net profit and a maximum equity drawdown of roughly 1,000 USD indicates an EA that “gradually grows the account over time while occasionally experiencing drawdowns of several hundred dollars.”
The high win rate and smooth equity curve are very appealing at first glance, but behind them lies a martingale-style logic that increases lot size stepwise after losses. Depending on market conditions, you must be prepared for the possibility that drawdowns may become significantly larger than in the historical test. The backtest suggests that this is not an ultra-high-risk EA where you should expect to hit zero frequently, but it is one where “the EA is manageable if you keep the lot size modest, while poor lot management can quickly erode the account.”
Using these backtest findings as a base, the next section breaks down the trading logic and risk profile in more detail, focusing on the conditions under which lot size increases and the types of price action that tend to produce drawdowns.
Trading Logic and Risk Profile
Basic Concept: Trend-Following EA for Gold
According to the developer, GoldSky is a day-trading EA that opens trades in the trend direction on gold (XAUUSD). It operates on the M1 chart and combines candlestick patterns with indicators such as moving averages, ADX and Force Index to judge both the direction and strength of the trend.
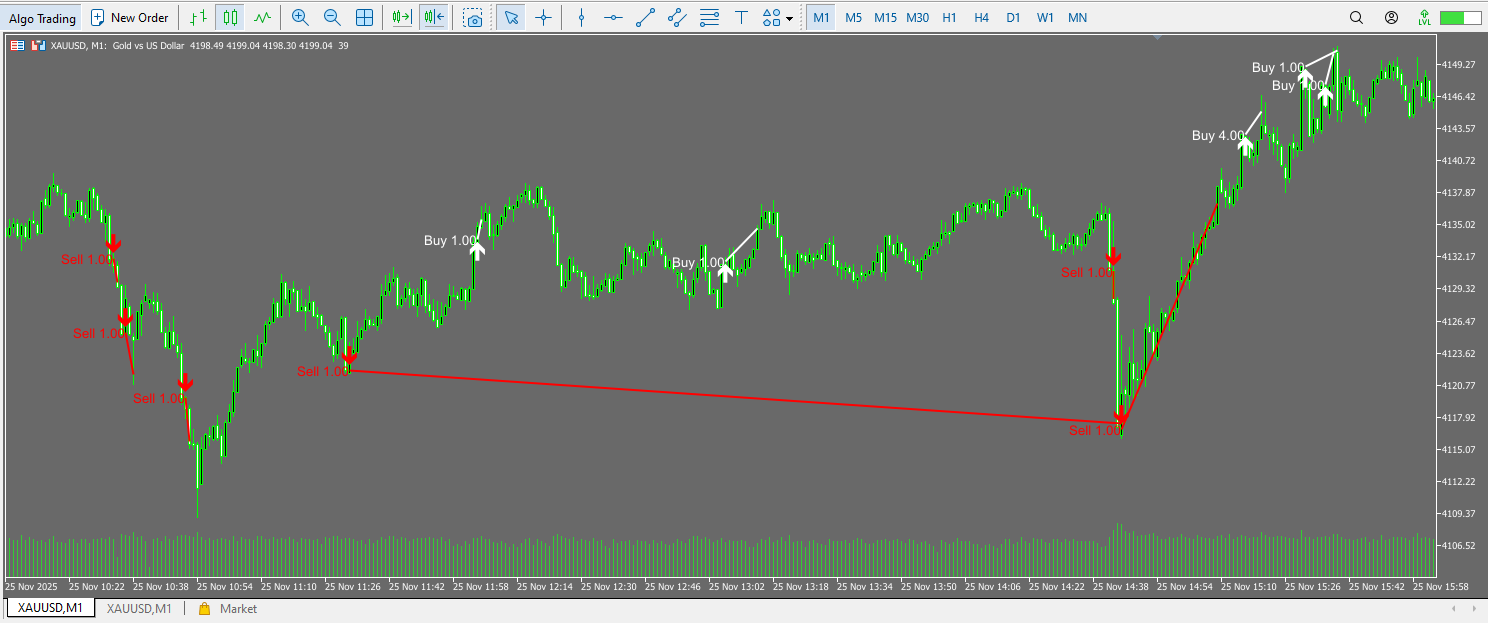
In practice, the EA focuses on long (buy) entries in uptrends and short (sell) entries in downtrends, trying to avoid extended range conditions or prolonged counter-trend moves as much as possible. Positions are opened at the open of a new bar, so instead of chasing price mid-candle, the EA effectively waits for a bar to close and then decides its next move at the bar open.
Entries and Exits: Fixed Stop and Trailing for Profit Taking
A key feature of GoldSky is that every trade has a clearly defined stop-loss. The developer states that the default is a fixed stop of around 20 dollars in gold price, and when the market moves in the anticipated direction, profits are taken using a trailing stop.
As a result, most winning trades are closed with relatively modest profits, and on the chart you can often see the EA repeatedly “entering in the trend direction and closing within a short time.” Conversely, when price moves sharply against the position, the trade is held until it hits the preset stop, which can make each losing trade several times larger than the typical winner.
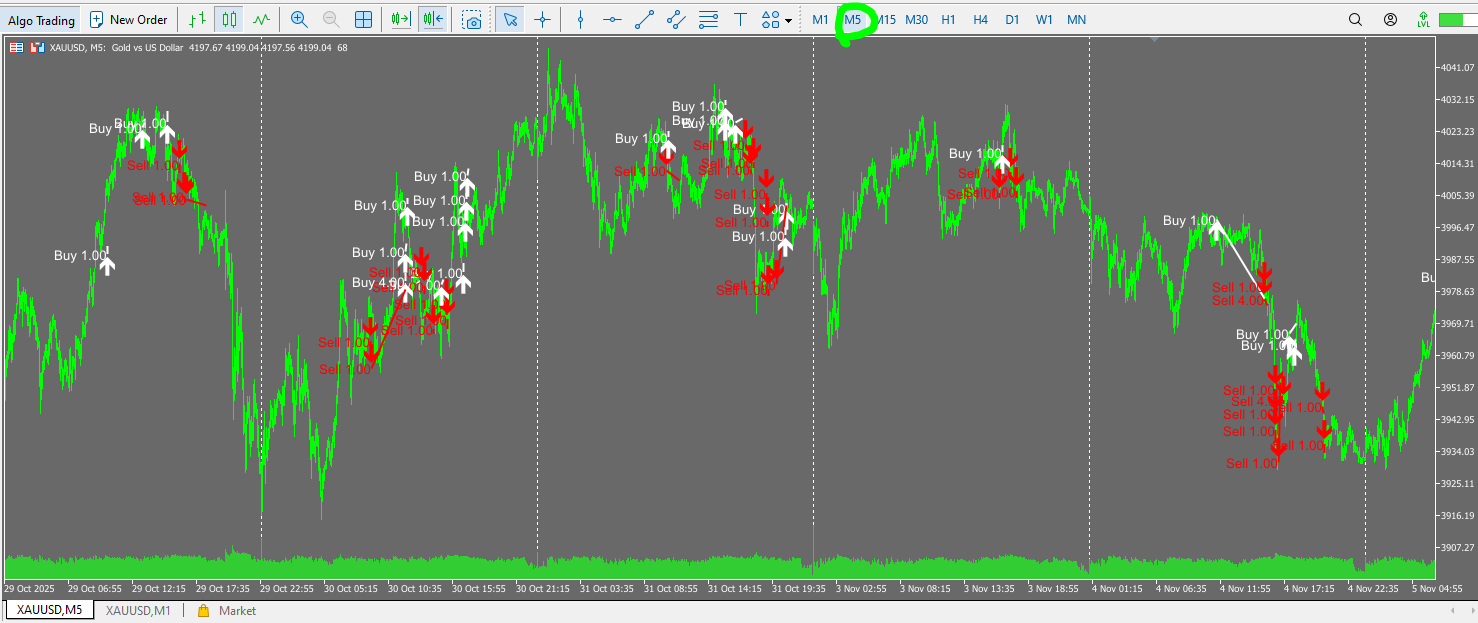
Martingale-Style Risk Management: Increasing Lot Size After Losses
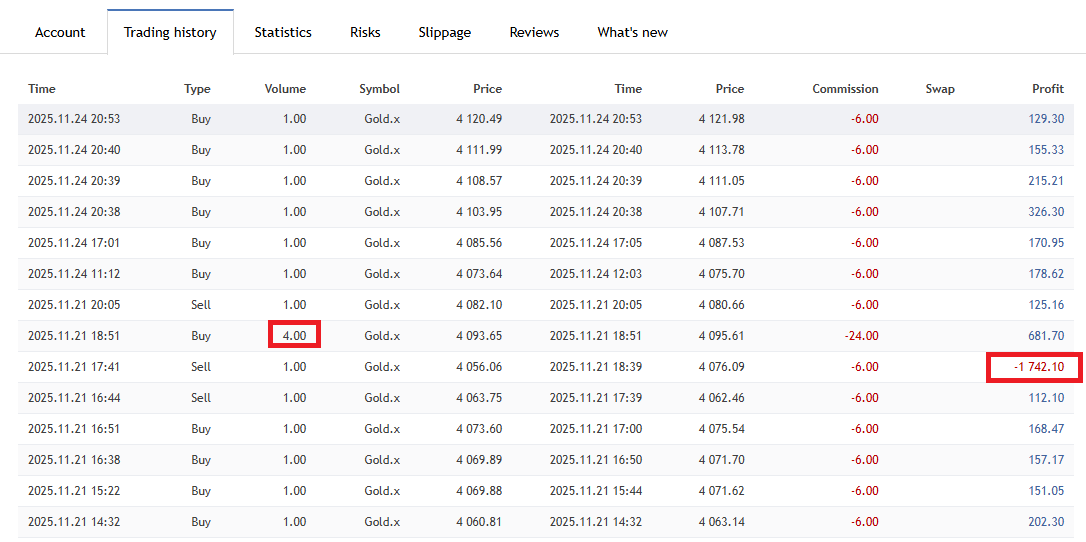
The developer states that GoldSky does not use grid or martingale, but when you plot the actual forward trades on the chart, it becomes clear that lot size often increases significantly right after a loss.
For instance, in some sequences the EA places a series of trades at 1.00 lot, but after a losing streak it opens a 4.00-lot position. If that enlarged trade then hits the stop, it results in a single large loss. This is not a classic “double after every loss” martingale designed to completely recover all previous losses at once, but it is clearly a martingale-style approach in the sense that it raises the lot size after losses to accelerate recovery.
This lot escalation can significantly boost equity when the market quickly returns to favorable conditions and losing streaks remain short. However, if the market continues to move unfavorably while the lot size is elevated, there is a real risk of experiencing a rapid series of stop-losses, each with a large monetary impact. This is the single most important risk factor to understand before using GoldSky.
Who This Trading Logic Is (and Isn’t) For
The combination of straightforward trend-following entries and martingale-style lot increases can produce very attractive performance while conditions are favorable. At the same time, during prolonged counter-trend phases or periods of sharp intraday volatility, repeated stop-losses at increased lot sizes can cause equity swings to become much larger.
Because of this, GoldSky is best suited to traders who:
・Want a trend-following gold EA focused on intraday trading
・Understand and accept that “steady small wins with occasional large losses” is the inherent risk profile
・Can commit to keeping lot sizes modest relative to account balance, without over-leveraging
On the other hand, traders who are looking for an EA that “grows steadily with fixed lot sizes and minimal drawdowns,” or who absolutely want to avoid any large drawdowns, may find GoldSky’s risk characteristics stressful. Choosing an appropriate lot size is the most important factor in whether you can live comfortably with this EA.
Overall Evaluation and Conclusion
Strengths of GoldSky
- Has a track record of significantly growing account balance over about two years of forward trading (as of December 2025).
- Trend-following entries make the behavior on the chart relatively easy to understand.
- Every trade has a stop-loss; it does not leave positions open indefinitely without an exit.
- Operates as an M1 day-trading EA that generally avoids overnight positions, making it suitable for intraday-only strategies.
- Shows a gently rising equity curve across 20 years of backtest data, indicating long-term robustness under tested conditions.
Key Risks and Points of Caution
- Despite the high win rate, the loss from a single losing trade can be equivalent to several winners, creating a “high-win-rate but large occasional loss” payoff profile.
- Uses martingale-style money management that increases lot size after losses, so losing streaks or sudden market shocks can produce large, rapid drawdowns.
- Even though it is not a classic doubling martingale, the nature of increasing lot size after losses means that over-sizing positions can quickly cause severe damage to the account.
- Both forward and backtest results include episodes of drawdowns in the range of several hundred to several thousand dollars; traders who absolutely want to avoid any large losses may find this uncomfortable.
- Real-world performance is highly dependent on broker conditions such as spread and execution quality, so reproducing the developer’s results on a low-quality broker is unlikely.
Who Is GoldSky Suitable For?
- Traders who want a trend-following EA for gold, with a high win rate and intraday trading focus.
- Those who understand and accept a risk profile of “many small wins with occasional larger losses.”
- Those who can keep lot sizes conservative relative to account balance and avoid over-leveraging (not “chasing” higher returns by scaling lots too aggressively).
Final Verdict (as of December 2025)
At present, GoldSky can be described as an EA that combines trend-following entries with post-loss lot increases to deliver a high win rate and an attractive equity curve. However, behind this lies a clear martingale-style risk, and if the market environment turns unfavorable, drawdowns could easily exceed what has been seen so far.
To use GoldSky safely, it is crucial not to be greedy with lot sizes and to decide in advance how much absolute loss (in dollars or euros) you are willing to tolerate. Using the forward and backtest analyses in this article as a reference, you should carefully assess “what lot size and which broker conditions are acceptable” based on your own risk tolerance and trading style.
Finally, this review is based solely on data available as of December 2025, and future performance and risk may change significantly depending on market conditions. If you decide to use GoldSky, be sure to keep checking the latest forward results and adjust your judgment accordingly.
Entries follow the trend direction and every trade has a stop loss, but the EA uses martingale-style money management that quadruples the lot size after a loss. It is not a classic “double-up” martingale, yet there is a real risk that a losing streak can produce losses in the range of several thousand up to ten thousand euros in a single sequence. If you increase the lot size too aggressively, there is a genuine risk of blowing up the account, so this EA is more suitable for traders who are willing to stick to small lot sizes.