When it comes to expectancy, what should I actually look at?
A high win rate feels “safe”… but it’s not that simple, right?

Correct. The key is not the win rate itself, but the structure that tells you how much your account tends to grow (or shrink) on average over the long run.
Trade expectancy (EV) evaluates not only the win rate, but also your average win and average loss.
So even with a high win rate, a system can still have negative expectancy if it is designed to “lose big once in a while.”
In this article, I’ll keep it simple so beginners can judge for themselves—covering expectancy, how to calculate it, and the basics of risk and money management.

Introduction
“90% win rate,” “Anyone can profit easily”—phrases like these can sound tempting.
But what truly matters in trading is not how often you win. It’s whether your strategy has a repeatable structure that grows your capital on average.
That is exactly what expectancy (EV) measures. Expectancy is the indicator that shows the average profit or loss per trade if you repeat the same setup under the same rules.
Even with a high win rate, a strategy can still have negative expectancy if rare but large losses wipe out the gains. On the other hand, even if your win rate is not high, you can still achieve positive expectancy if the balance between wins and losses is sound.
This article starts with the core concept of expectancy, then walks through the calculation, real examples, and common misunderstandings in a clear order. I’ll also explain how to reduce rule-breaking caused by emotions, why EAs (automated trading) make testing easier, and how to avoid being misled by “signal tool” marketing numbers.
- A clear standard for not judging by win rate alone
- How to calculate and evaluate your strategy’s expectancy objectively
- Why how you lose (loss size) often determines your results
- How to shift toward testable, verifiable trading
Instead of being pushed around by win rate, you need the skill to judge—based on numbers—whether a strategy is worth running over the long term.
What Is Trade Expectancy? The Core Concept Profitable Traders Always Understand
Trade expectancy (Expected Value, EV) is a metric that shows the average profit or loss you can expect over the long run when you repeat the same trading rules. It is based on probability and is widely used not only in investing, but also in decision-making in general.
The most important point is that expectancy reveals the true “profit structure” that a simple win rate cannot show. It evaluates your strategy by including both average win size and average loss size, and helps you judge whether the system is fundamentally designed to grow capital.
The 3 Building Blocks of Expectancy
To understand and verify expectancy, you need to organize these three elements:
- Win Rate: the percentage of trades that end in profit
- Average Win: the average profit of winning trades
- Average Loss: the average loss of losing trades
Expectancy Formula (Minimum You Need)
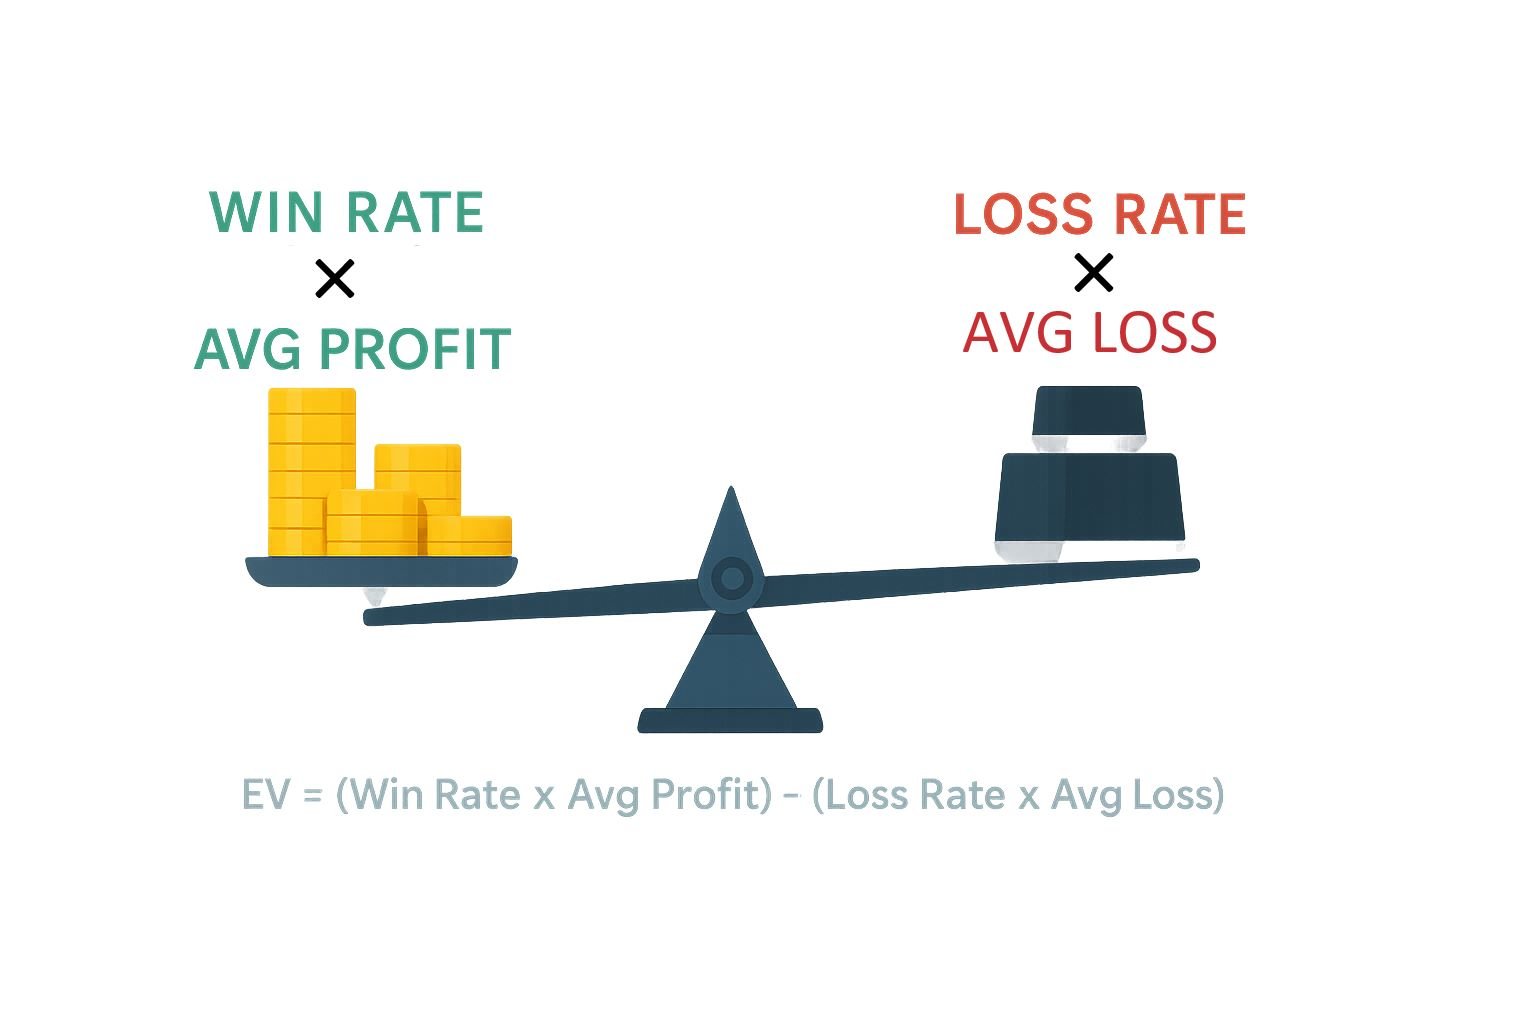
Expectancy can be captured with one simple formula:
Expectancy = (Win Rate × Average Win) − (Loss Rate × Average Loss)
*Loss rate is “1 − win rate.”
Example: Win rate 40%, average win $300, average loss $100
Expectancy = (0.4 × 300) − (0.6 × 100) = +$60
This means the system has a structure that tends to produce +$60 per trade on average over many trades (separate from short-term wins and losses).
Risk-Reward (Payoff Ratio): What It Means and Why It Matters
Risk-reward (payoff ratio) is the ratio between how much you lose when you’re wrong (risk) and how much you make when you’re right (reward).
For example, if you aim to lose $100 when wrong and make $200 when right, that trade has a risk-reward of 1:2.
This matters because you can be profitable even without a high win rate—as long as your payoff structure supports positive expectancy.
On the flip side, a poor risk-reward structure (small wins, large losses) can break a strategy over time even if the win rate looks impressive.
- Good risk-reward (e.g., 1:2, 1:3): you can grow capital even with a moderate win rate
- Poor risk-reward (e.g., 2:1, 3:1): you must maintain a high win rate, or expectancy often turns negative
In practice, “average win” and “average loss” in the expectancy formula are essentially the real-world risk-reward inside your trade history.
So if you want to improve expectancy, chasing win rate is usually not the first step. A more realistic order is:
reduce losses first, then avoid cutting winners too early.
The Core Truth: A “100% Win Rate” Is Not Realistic
Many beginners aim for “never losing,” but consistently achieving a 100% win rate in real markets is not realistic. What matters is accepting that losses will occur—and building a structure where your average win exceeds your average loss.
That structure leads to positive expectancy.
Consistently profitable traders focus on expectancy because they do not rely on short-term outcomes. They stick to a strategy with positive long-term expectancy and execute it with discipline.
Related: Probability-Based Forex Trading: Expectancy, Risk–Reward & EA Backtesting
Expectancy in Practice: Use Numbers to See What Win Rate Alone Can’t
Here we calculate expectancy (EV) using sample trade data to reveal the “profit structure” that win rate alone can hide.
We also standardize the notation for risk-reward, which often confuses beginners.
Example: Calculate Expectancy from 20 Trades
Below is a sample summary of 20 trades (numbers are adjusted to stay realistic and easy to follow).
| Result | Count | Total P/L | Average P/L |
|---|---|---|---|
| Winning trades | 7 | $1,400 | $200 |
| Losing trades | 13 | -$1,300 | -$100 |
Calculation (Expectancy)
- Win rate = 7 ÷ 20 = 35%
- Average win = 1,400 ÷ 7 = $200
- Average loss = 1,300 ÷ 13 = $100
- Expectancy = (0.35 × 200) − (0.65 × 100) = 70 − 65 = +$5
The win rate is only 35%, but expectancy is +$5 per trade. In theory, over many trades, this structure tends to drift positive (even though losing streaks can still happen).
Risk-Reward and Break-Even Win Rate
- Risk-reward 1:2 means “risk 1 to make 2”
- In the example above, average loss is $100 and average win is $200, so risk-reward is 1:2
With a 1:2 payoff, the break-even win rate (the minimum needed for expectancy to lean positive) is:
- Break-even win rate = 1 ÷ (1 + 2) = about 33.3%
So with a 1:2 payoff, winning above ~33.3% often makes expectancy positive. Our 35% win rate clears that threshold, which is why expectancy is positive.
Case Study: The Same Win Rate Can Produce Opposite Results
Even with similar win rates, expectancy can flip just by changing average win vs average loss (i.e., the payoff structure).
Case A: High win rate, but “small wins and big losses”
- Win rate: 80%
- Average win: $30
- Average loss: $150
- Expectancy = (0.8 × 30) − (0.2 × 150) = 24 − 30 = -$6
The win rate looks great, but one loss is so large that the long-run structure tends to turn negative.
Case B: Moderate win rate, but “cut losses and let winners work”
- Win rate: 40%
- Average win: $200
- Average loss: $100 (risk-reward 1:2)
- Expectancy = (0.4 × 200) − (0.6 × 100) = 80 − 60 = +$20
Even with a 40% win rate, expectancy can be positive when wins are meaningfully larger than losses.
Why “High Win Rate = Safe” Is a Dangerous Assumption
A common beginner mistake is treating win rate as the main proof of quality.
Some high-win-rate strategies rely on many small wins and accept rare but large losses. They often look strong in the short run, but one loss can erase months of gains, and performance can break suddenly.
Related:Stop Chasing Win Rate: How to Evaluate Forex EAs with Expectancy, Risk-Reward & Drawdown
Practical Priority: How to Improve Expectancy
- First, control average loss: when losses grow, expectancy collapses—even if the win rate is high
- Second, stop cutting winners too early: taking profit too quickly often worsens the payoff ratio
- Finally, refine win rate: improving win rate helps, but it is often harder than fixing payoff structure
Expectancy must be judged as a set: win rate + average win + average loss.
Expectancy and Psychology: Build a Decision Standard That Resists Emotion
Expectancy is not something you “calculate once and forget.”
Many trading blow-ups come not from the strategy itself, but from breaking the rules under pressure—late stop-losses, early profit-taking, or oversizing after a streak.
Related: Emotions in Forex Trading: 7 Triggers That Break Your Rules (And How to Fix It)
Expectancy gives you an objective standard to reduce that drift.
It helps you judge decisions not by one outcome, but by whether the setup tends to be profitable over many repetitions under the same conditions.
Common Decision Errors, Reframed Through Expectancy
1. Judging everything by one result (short-term outcome bias)
If you label a decision “right” after a win and “wrong” after a loss, your evaluation becomes unstable.
Expectancy thinking judges decisions by the average result over repeated trials.
- A losing trade can still be a correct decision if it came from a positive-expectancy setup
- A winning trade can still be dangerous if the setup is negative expectancy over time
2. Delaying stop-losses (loss aversion)
Late stop-losses inflate average loss and can destroy expectancy quickly.
A stop-loss is not “admitting defeat.” It is a procedure to keep average loss controlled and protect expectancy.
- Following stops keeps average loss stable, making your expectancy calculation reliable
- Breaking stops can make a “high win rate” strategy collapse over time
3. Rule breakdown after streaks (overconfidence / revenge behavior)
After a winning streak, traders often loosen rules. After a losing streak, they often try to “win it back” by pushing size.
From an expectancy perspective, the key is not the streak itself, but whether you can repeat positive-expectancy setups with consistent quality.
Simple “Checks” to Reduce Emotional Drift
To reduce emotional mistakes, fix your checks before you trade. Here is a minimum set that beginners can follow.
Before entry: minimum checks
- Does this setup tend to be positive expectancy? (based on your testing/data)
- Is the payoff still valid? (are you risking too much for too little reward?)
- Is the worst-case loss acceptable? (will one trade break your plan?)
During the trade: “do-not-do” checks
- Am I widening the stop? (increases average loss)
- Am I taking profit too early? (reduces average win)
- Am I adding size outside the plan? (often leads to oversized exposure)
When You’re on a Losing Streak: What to Review, in Order
Losing streaks often trigger “Maybe the strategy is broken.” Before you change anything, check in this order:
- Did you follow the rules? (late stops, early exits, size changes)
- Does expectancy hold after costs? (spread widening, slippage, commissions)
- Did the market regime change? (range to trend, volatility spike, etc.)
Losing streaks are not rare. Even with a 60% win rate, a 5-loss streak can happen statistically. The real danger is breaking your expectancy assumptions by changing conditions or increasing size because of the streak.
Expectancy becomes your anchor when emotions spike. Judging by conditions and numbers—rather than feelings—improves stability.
EAs (Automated Trading) and Expectancy: Easier to Test, but Full of Traps
Automated trading using EAs (Expert Advisors) pairs well with expectancy-based thinking.
The reason is simple: an EA can execute the same rules the same way every time, which makes both backtesting and real execution easier.
However, using an EA does not automatically mean “safe” or “profitable.”
Even if a backtest shows positive expectancy, real trading can break it due to trading costs (spread, slippage) or over-optimization (fitting the past).
Related: What Is a Forex EA (MT4/MT5)? An Automated Trading Guide
Why EAs Fit Expectancy-Based Trading (3 Reasons)
1. You can test a large number of trades quickly (easier expectancy estimates)
Expectancy becomes more reliable as the number of trades increases because random noise shrinks.
Manual testing is slow and stressful, but an EA makes it practical.
- Reproduce hundreds to thousands of trades quickly
- Test across different conditions (trend, range, volatility shifts)
- Compare setups under identical rules and find improvements faster
2. Forward testing confirms “real-world conditions”
Backtests are useful, but real trading includes slippage and spread changes.
Forward testing means running the EA on a real (or demo) account and reviewing the results to confirm expectancy under live conditions.
- Evaluate with real costs (slippage, spread, commissions)
- Check whether the gap vs backtest is large or small
- If the gap is large, execution conditions may be the issue—not just logic
3. It helps reduce “rule-breaking” caused by emotion
In discretionary trading, traders often delay stops or take profits too early, which can break expectancy.
Because an EA executes mechanically, it can reduce these inconsistencies.
- Stops are followed more consistently, so average loss is less likely to inflate
- Profit-taking stays consistent, so average win is more stable
- As a result, expectancy tends to be less erratic
How to Improve Expectancy with an EA (Keep It Simple)
With EAs, chasing win rate is usually less important than maintaining a healthy balance between average win and average loss.
- Is the stop-loss too wide? Larger average losses often damage expectancy
- Is the take-profit too small? Small average wins make it hard to grow capital even when you win
- Is position size too large? Even with positive expectancy, you may not survive the drawdown
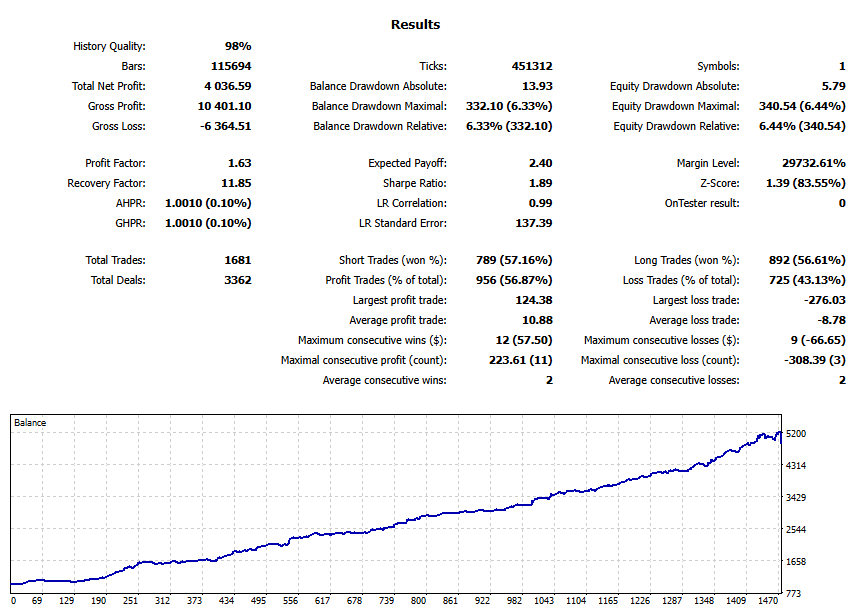
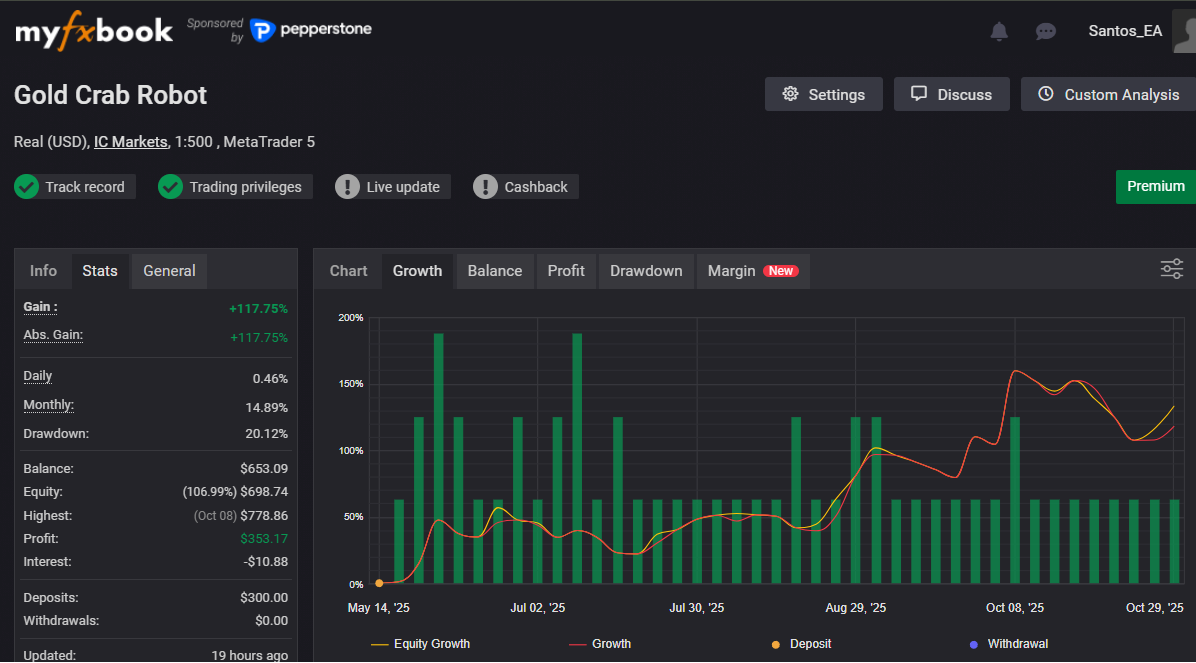
EA Warning: Don’t Judge by “Pretty Equity Curves” or High Win Rates
Many EA sellers combine smooth, rising equity curves that appear to have little drawdown with high win rates and aggressive marketing.
But “good-looking numbers” do not guarantee future expectancy (long-run average outcomes). With EAs, you must watch for these common traps.
1. Over-Optimization (Curve Fitting): Expectancy May Be “Manufactured”
Over-optimization means tuning parameters too tightly to past data, creating a system that is strong in the past but weak in the future.
A great backtest feels reassuring, but if curve fitting is present, the expectancy may be less “real” and more built for history.
- Backtest looks excellent, but forward results collapse
- Performance changes drastically when you shift the test period
- Small setting changes cause huge performance swings
Related:EA Overfitting (Over-Optimization): How to Detect It Before You Buy
2. Grid / Martingale: One move can blow the account
Grid and martingale-style averaging strategies often show high win rates and smooth curves in the short term.
But structurally, if price trends hard in one direction, losses can expand quickly, leading to account blow-up or a fatal drawdown.
- Often a “wins most of the time, but takes a lethal hit sometimes” profile
- If the backtest period does not include the worst conditions, the real risk stays hidden
Related:
» Why Grid Forex EAs Blow Up: Hidden Drawdowns + Red Flags (Self-Made EA Test)
» Martingale EAs: Why They Blow Up (Backtest Proof + Checklist)
3. Scalping: Results change easily across brokers and environments
Scalping EAs target small price moves, so spread, slippage, and execution delays matter much more.
A strategy that works in backtesting can lose its expectancy in live trading and fail to reproduce results.
- Account type (commission/spread) and trading hours can change outcomes
- VPS quality, latency, and broker execution quality can directly impact results
Related:Scalping EAs: Why They Often Fail on Live Accounts (Costs, Slippage, Execution)
Bottom Line: Don’t Judge Expectancy from Backtests or Short Forward Tests Alone
EAs are powerful because they are testable—but they also make it easy to create numbers that look great.
So you should not blindly trust expectancy from backtests or short forward tests.
If you use an EA, evaluate not only “how big” the expectancy looks, but also whether it stays stable when conditions change—its robustness.
Concretely, you want performance that does not collapse when you change the period or assumptions, that survives after trading costs, and that does not contain a built-in “one-shot ruin” risk.
For more detail, see: What is EA robustness? How to Choose a Forex Trading Robot That Won’t Blow Up
[Important] Signal Tools and Indicators Alone Don’t Make You Profitable — Expectancy Comes from a Tested Strategy
“If I find a high-accuracy signal tool, I’ll win.” “Just follow the arrows and profit.”
This is a common beginner misunderstanding.
In short: a signal or indicator itself does not create expectancy (long-run average profit). Expectancy is determined by the entire strategy—entry, stop-loss, take-profit, and money management.
Signal tools can be helpful as support, but relying on them without testing often leads to a situation where the win rate looks high, yet the account still declines.
Why Signal Tools Alone Are Not Enough (Why Expectancy Fails)
Most signal tools and indicators only show an “entry point” such as buy here / sell here.
But expectancy is not decided by entry alone. Without exit rules and risk control, expectancy can turn negative easily.
- No clear exits (TP/SL): If profit-taking and stop-loss rules are vague, average loss can grow fast
- No position sizing plan: The same signal can produce very different outcomes depending on size
- Insufficient testing: A signal that “looks accurate” is not the same as a strategy with positive long-run expectancy
Sales Red Flags: Big Numbers + Weak Verification
Signal tool marketing often emphasizes attractive numbers and phrases.
Not every product is dishonest, but when multiple red flags appear together, caution is justified.
Common warning signs
- Unusually high win-rate claims (e.g., 90%+) with little explanation of losses
- “Easy,” “Anyone can do it,” “Set-and-forget” style messages that dismiss testing
- Backtest/forward test conditions are unclear (period, pair, costs, rules not explained)
- No maximum drawdown disclosure or no explanation of losing periods
- High price with vague proof and vague refund terms
Why Tools Without Expectancy Verification Are Dangerous
Expectancy changes quickly once you include the real factors below. If these are not tested, a tool can “look accurate” but still lose money over time.
- Trading costs: spread, commission, and slippage reduce average wins
- Real payoff structure: small profits + large losses can create negative expectancy even with a high win rate
- Market regimes: it may work in ranges but break in strong trends (or vice versa)
- Long-term stability: short-term results do not prove the expectancy will persist
Minimum Checklist for Evaluating a Signal Tool (Beginner-Friendly)
If you use a signal tool or indicator, checking these points before you buy or rely on it can reduce risk.
What to confirm before using it
- Backtest conditions: period, pair, spread, commission, and position sizing are clearly stated
- Forward results: not just a few days—enough time to show stability
- Maximum drawdown: “How bad can it get?” must be disclosed
- Exit rules: clear TP/SL and “when to stop trading” conditions
- Third-party proof: not only the seller’s claims, but verifiable data if possible
Expectancy Comes from Strategy Quality, Not “Signals”
What matters is not the signal accuracy, but whether the strategy as a whole has positive expectancy.
Expectancy is created by the full design:
- Entry rules: repeatable and clearly defined
- Take-profit and stop-loss: average win and average loss are balanced
- Money management: position size and maximum risk are planned
- Verification: expectancy stays above zero in backtests and forward tests
- Robustness: it does not collapse when market conditions shift
Conclusion: There Is No Magic Tool — Expectancy Matters Only When You Can Verify It
Signal tools and indicators can help, depending on how you use them. But they do not automatically provide a profitable expectancy.
The fastest way to protect your capital is to ask not “Does it hit?” but Does it have a positive long-run structure (expectancy)?
One key point to remember:
Expectancy does not come from the signal. It comes from the tested strategy as a whole.
Related: Why FX signal tools often fail (risks and alternatives) / Why indicators alone don’t make you profitable
Summary: Trade with Expectancy as Your Core Standard
If you want consistent results, focus less on win rate or “nice-looking” performance curves, and more on whether the strategy has a long-run structure that grows capital (positive expectancy).
Once you understand expectancy and can verify it with numbers, your decision-making becomes clearer—and you become far less vulnerable to emotion and marketing claims.
- Expectancy (EV) depends on more than win rate—it is defined by the balance of average wins and average losses
- High win rate strategies can still have negative expectancy if a few large losses erase the gains
- Risk-reward helps you judge profitability because it clarifies the win/loss balance behind expectancy
- EAs make testing and execution easier, but “good-looking traps” are common (curve fitting, grid/martingale blow-up risk, scalping execution sensitivity)
- Signal tools and indicators often show entries only—expectancy rarely holds without exits, money management, and verification
- Do not blindly trust backtests or short forward tests; prioritize robustness (stability under changing conditions)
In the end, the goal is simple:
Run a strategy with positive expectancy in a form you can verify and execute consistently.
Just adopting expectancy-based thinking significantly reduces the risks of chasing win rate, trading emotionally, and falling for exaggerated marketing.
FAQ: Expectancy, EAs, and Signal Tools (Common Questions)
- Q. If expectancy (EV) is positive, does that mean I will definitely win?
- A. No. Expectancy shows that the long-run average outcome tends to be positive, but short-term results can still include losing streaks. What matters is whether your money management can survive drawdowns while you allow the edge to play out over enough trades.
- Q. Isn’t a high win rate strategy safer?
- A. Not necessarily. A high win rate strategy can still have negative expectancy if it “wins small but loses big.” Win rate is only one part of the picture—you must also check average win vs average loss (risk-reward) and drawdown behavior.
- Q. Should I always target a fixed risk-reward like 1:2?
- A. There is no universal “best” ratio. The right payoff depends on the strategy and the win rate it can realistically achieve. The key is whether expectancy stays positive after trading costs, and whether the rules are practical to execute consistently.
- Q. Why can a positive expectancy backtest turn negative in live trading?
- A. The most common causes are trading costs (spread/commission/slippage), over-optimization (curve fitting), and execution differences (latency/broker fill quality). That is why forward testing and stress testing under different assumptions are essential.
- Q. Are EAs better than discretionary trading?
- A. In terms of verification and repeatability, EAs often have an advantage because they execute rules consistently and reduce emotional bias. However, EAs also come with common traps—curve fitting, grid/martingale blow-up risk, and execution sensitivity—so robustness checks are critical.
- Q. Why can’t I just win by following a signal tool (indicator arrows)?
- A. Because expectancy is not created by entries alone. Most signal tools do not define exits (TP/SL), position sizing, or a tested framework that survives costs and market changes. Expectancy comes from the full strategy design and verification.
- Q. What should I check before buying an EA or a signal tool?
- A. At minimum, confirm maximum drawdown, the test period length, whether results include realistic costs, and whether performance remains stable across different periods/conditions (robustness). Avoid products that rely only on win rate or “perfect-looking” curves without clear risk disclosure.