EA Overview
| Martingale | No |
|---|---|
| Grid | No |
| Scalping | Yes |
| Trading Pairs | XAUUSD |
| Timeframes | 1H |

Forward Test Analysis: Reviewing the Current MQL5 Signal Performance
This section summarizes and evaluates the forward performance of Cryon X 9000 EA MT5 (CryonX EA) based on public MQL5 Signals information available as of today. Because the operating period is short and the number of trades is limited, please note that the conclusion here is provisional.
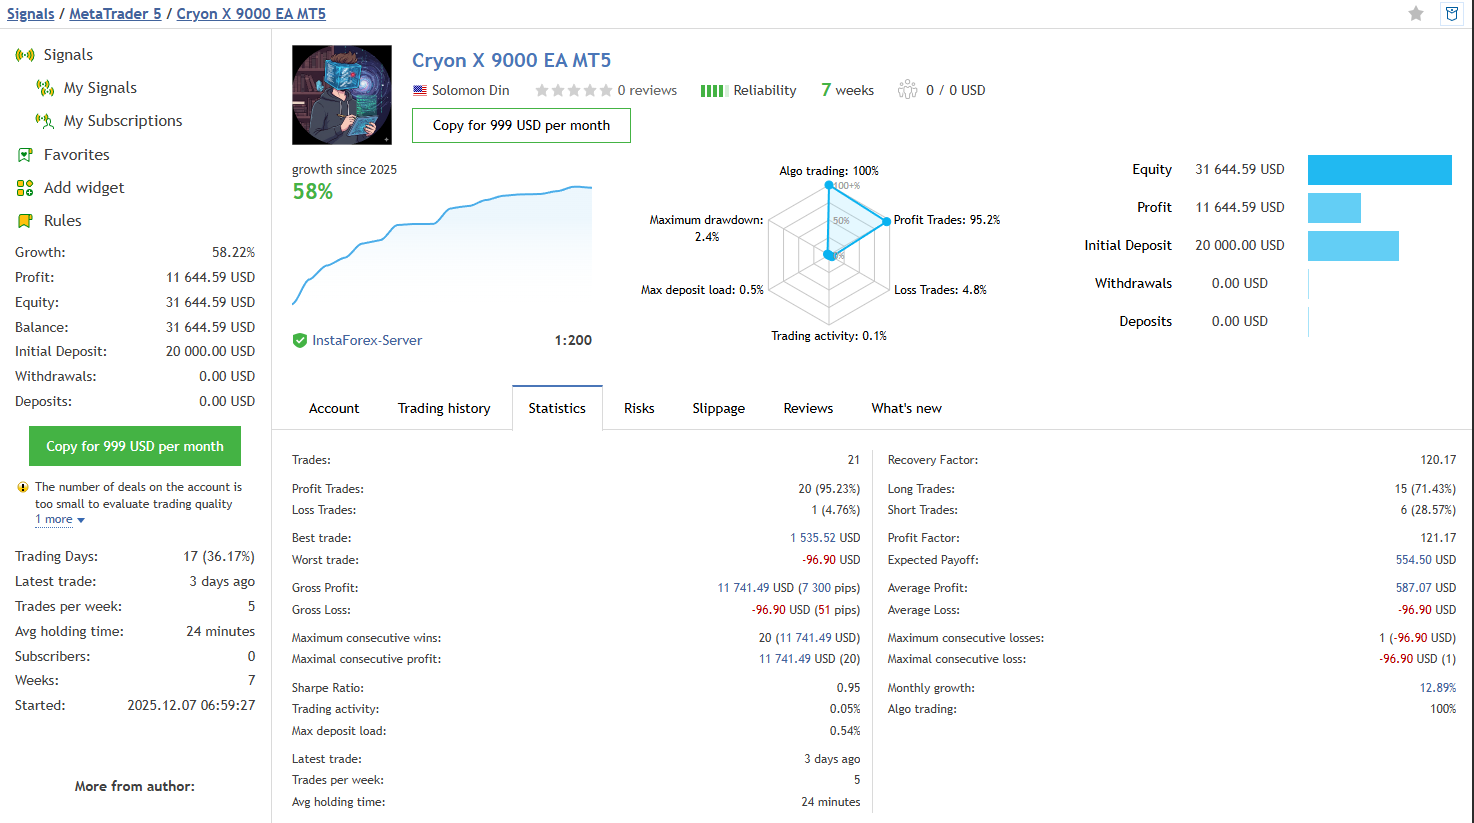
A forward track record is publicly available on MQL5 Signals
This EA publishes its forward performance (real-time live results) on MQL5 Signals. From a review perspective, it is meaningful that trackable performance exists on a third-party platform. However, a signal is still one account’s performance and does not guarantee future profits.
Performance looks excellent so far (but the sample is small and short-term)
The published metrics look very strong at this point. Growth is high, and the win rate appears extremely high. Maximum drawdown also looks small, and losing trades appear limited, so at this stage it can look like the EA operates with a tight loss profile.
That said, the operating period is short and the trade count is low, so it is not statistically robust yet. Resilience during regime changes (sharp volatility spikes, trend reversals, sudden volatility expansion, etc.) must be judged after more data accumulates.
No withdrawals or deposits is a positive sign, but long-term validation is still required
At least at the time of checking, there are no withdrawals or additional deposits shown. This reduces the likelihood of “cosmetic” performance shaping via external cash flows and can be a small positive. Still, this is only a snapshot and does not guarantee the same pattern going forward.
Trade history does not strongly suggest grid/martingale behavior (so far)
Within the trade history that can be checked at this point, there is no strong sign of classic grid behavior (adding positions at fixed intervals) or martingale behavior (increasing lot sizes aggressively as price moves against the position).
However, confirming grid/martingale behavior requires ongoing observation of position stacking, lot-size progression rules, and “hold and recover” patterns. With a short and limited sample, it is safer to state only that “there is no strong sign of it at this moment”, rather than making a definitive claim.
Provisional conclusion: It looks great, but the final verdict depends on more data
In summary, CryonX EA’s forward performance looks excellent as of today, with a high win rate, limited-looking losses, and a small-looking drawdown. But because the record is short and the trade count is low, this evaluation remains provisional.
In this review, I treat the forward results as a strong positive signal, while continuing to validate the EA more carefully in the next sections from the perspective of backtest conditions, logic inference, and risk characteristics.
Backtest Analysis: “Strength” and “Red Flags” Visible in 20 Years of Data (As of Jan 12, 2026)
In this section, I summarize the results of a backtest that I personally ran in the MT5 Strategy Tester for validation. Please note that this is a provisional review based on information as of Jan 12, 2026, and results can vary depending on broker conditions, historical data quality, spread assumptions, and execution specifications.
Backtest settings (my test environment)
- Period: Jan 1, 2005 – Jan 10, 2026 (about 20 years of data)
- Symbol: XAUUSD
- Initial deposit: 10,000 USD
- Lot size: Fixed 0.01 lot
- Other settings: Default
- Spread: 60 points
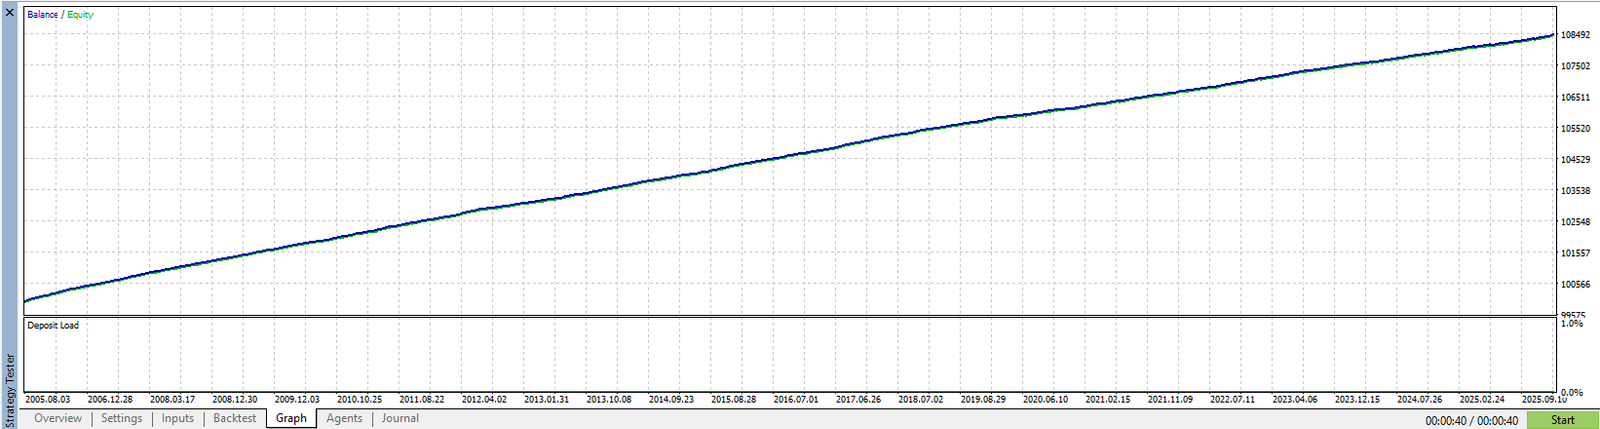
The balance curve rises almost in a straight line (an “almost too perfect” equity curve)
The first thing that stands out is how smooth and almost straight the balance/equity curve looks. Even across a 20-year test, there are hardly any visible drawdowns, creating what is close to an “ideal” equity curve.
While this looks impressive, real-world XAUUSD trading is highly sensitive to market regimes (sharp spikes, ranges, trend shifts, news-driven volatility, etc.), so results that look “too good” deserve extra scrutiny. In backtests, slippage, execution rejections, and dynamic spreads can be simplified compared to real trading. Therefore, I treat this smoothness as both “strength” and a potential “red flag” (i.e., whether the test environment is overly idealized).
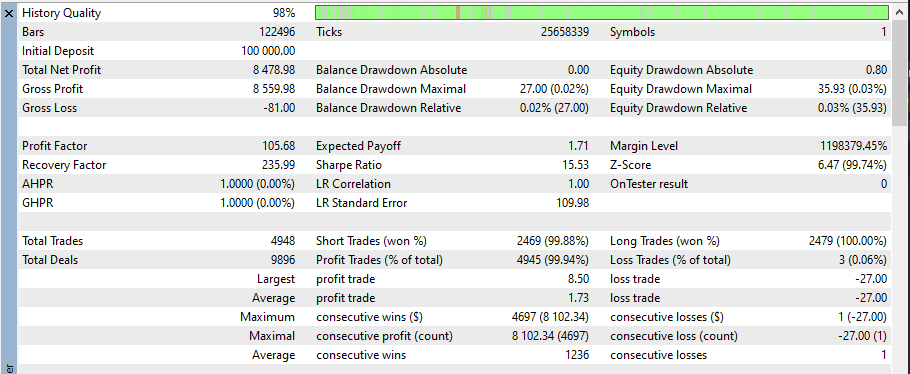
An unusually high win rate with almost no losses
The statistics show an extremely high win rate despite a large number of trades, with very few losing trades overall. Gross Loss is remarkably small, which suggests that losing trades are rare and minor.
This can look like “a very strong strategy” in a backtest, but it can also feel “too perfect” for a typical EA. In this review, I acknowledge how strong the numbers look, while checking risk exposure through the nature of losing trades in the next subsection.
Drawdown should be judged in absolute USD terms (not %), because the lot size is fixed
Percentage drawdown is highly dependent on the initial deposit and lot-size settings, which can make comparisons unstable. Because this test uses a fixed 0.01 lot, I evaluate drawdown primarily using the absolute equity drawdown in USD.
In the statistics, the absolute equity drawdown also looks very small. This suggests the strategy did not carry large floating losses. At the same time, because losses look almost “too small,” it is also important to consider whether the backtest assumptions (fixed spread, idealized execution, etc.) are inflating performance.
Losses are rare, but one loss still reveals a poor risk-reward profile
Even though losses are extremely rare, the losing trade that can be clearly observed suggests the risk-reward profile is not particularly attractive. If the EA accumulates many small wins but occasionally takes a comparatively large loss, it can face situations where performance collapses quickly in the future.
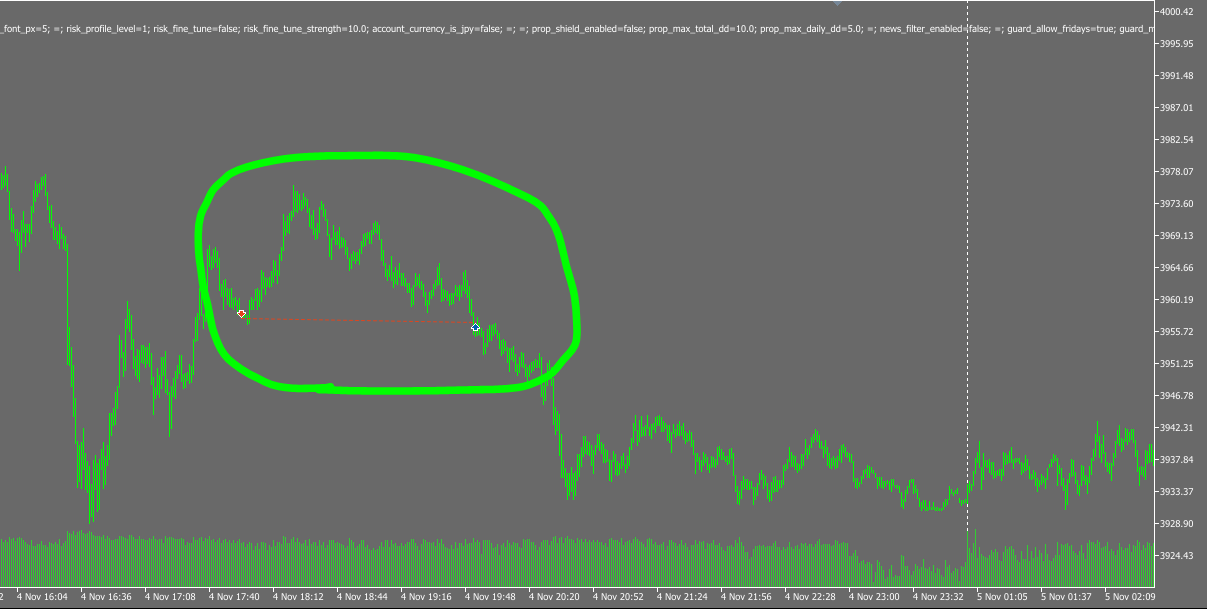
A concern visible in trade history: stop-outs may be slow
In the losing-trade example, the position appears to withstand an adverse move for a while before closing at a loss. This suggests stop decisions may be slow (or the stop distance may be wide).
Because the win rate is extremely high right now, this risk may not show up clearly. But when volatility spikes or a strong trend expands, repeated “hold-and-lose” trades can break the curve. Therefore, rather than relying only on a beautiful equity curve, I plan to keep focusing on maximum loss during losing streaks, how floating drawdown expands, and how stops are applied as more evidence accumulates.
Provisional conclusion: the numbers are outstanding, but the verdict should remain cautious
Across a 20-year test with a fixed 0.01 lot size, the curve is extremely smooth and the win rate is close to “perfect.” Based on the backtest alone, it is very attractive.
However, when a curve looks this perfect, it is essential to verify whether it can be reproduced in real trading. In the next sections, I will refine the conclusion carefully by focusing on consistency with forward performance and on trading logic and risk characteristics (slow stop-outs, skewed risk-reward, and resilience during sharp market moves).
Trading Logic & Risk Characteristics: Strengths and Weaknesses of a Scalping Style (As of Jan 12, 2026)
Here, I summarize CryonX EA’s trading logic and risk characteristics by combining the forward trade-history plot (white = Buy, red = Sell) with the developer’s own descriptions. This chapter is also a provisional review based on information available as of today.
What the developer claims (developer’s statements only)
- Designed primarily for XAUUSD (Gold)
- Recommends low spread and strong execution conditions (e.g., ECN)
- Claims not to use dangerous methods such as grid or martingale
- Mentions that settings like a news filter are “not mandatory”
The key point is that these are claims; actual behavior must be validated using forward results, backtests, and trade history.
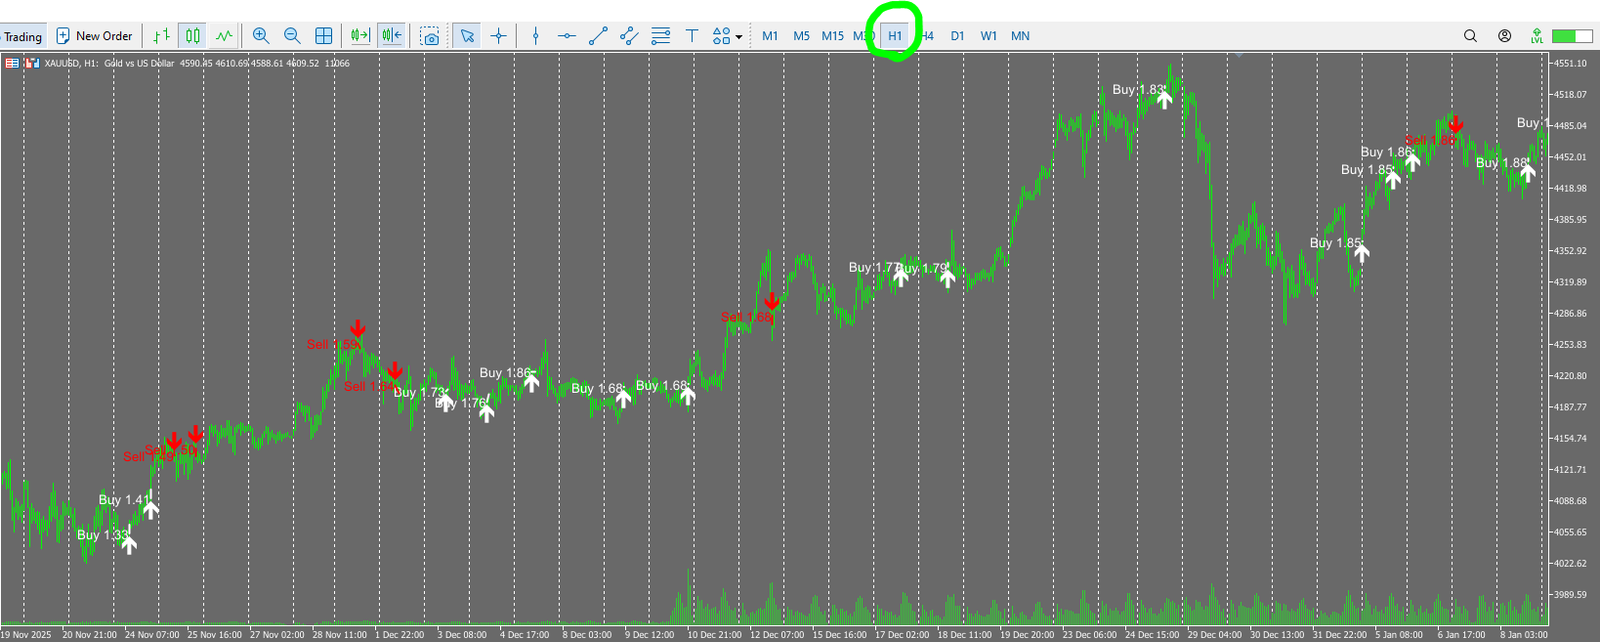
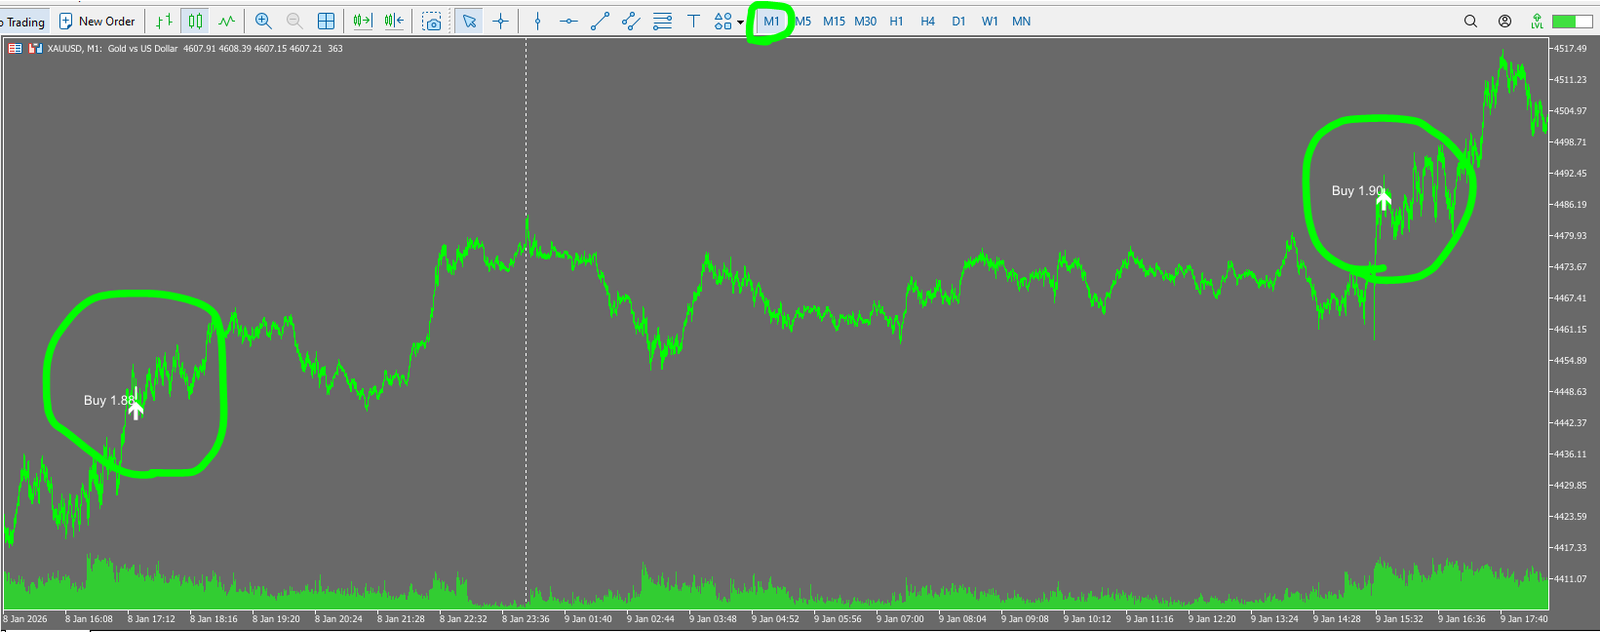
Trading style appears to be “tight-range scalping”
Based on the plotted trades, it looks less like “hold for big runs” and more like repeatedly capturing small price moves (short-term pullbacks and snapbacks). In other words, it appears closer to a scalping EA.
This style is often more sensitive to execution conditions than to the strategy concept itself. Even if the backtest or a short forward record looks great, results can deteriorate when broker/server conditions change. Spread, execution speed, slippage, and latency matter a lot.
No strong “classic” grid/martingale signs are visible
At least visually, the trade history does not show obvious patterns such as:
- adding positions at fixed intervals (grid)
- increasing lot sizes step-by-step as price moves against you (martingale)
This can be a reassuring point.
Still, you cannot confirm this definitively without long-term monitoring of stacking behavior and lot-size progression. So I describe it as no strong signs at this moment, not as a final judgment.
Biggest concern: stop-outs appear slow for a scalping EA (positions may be held in adverse moves)
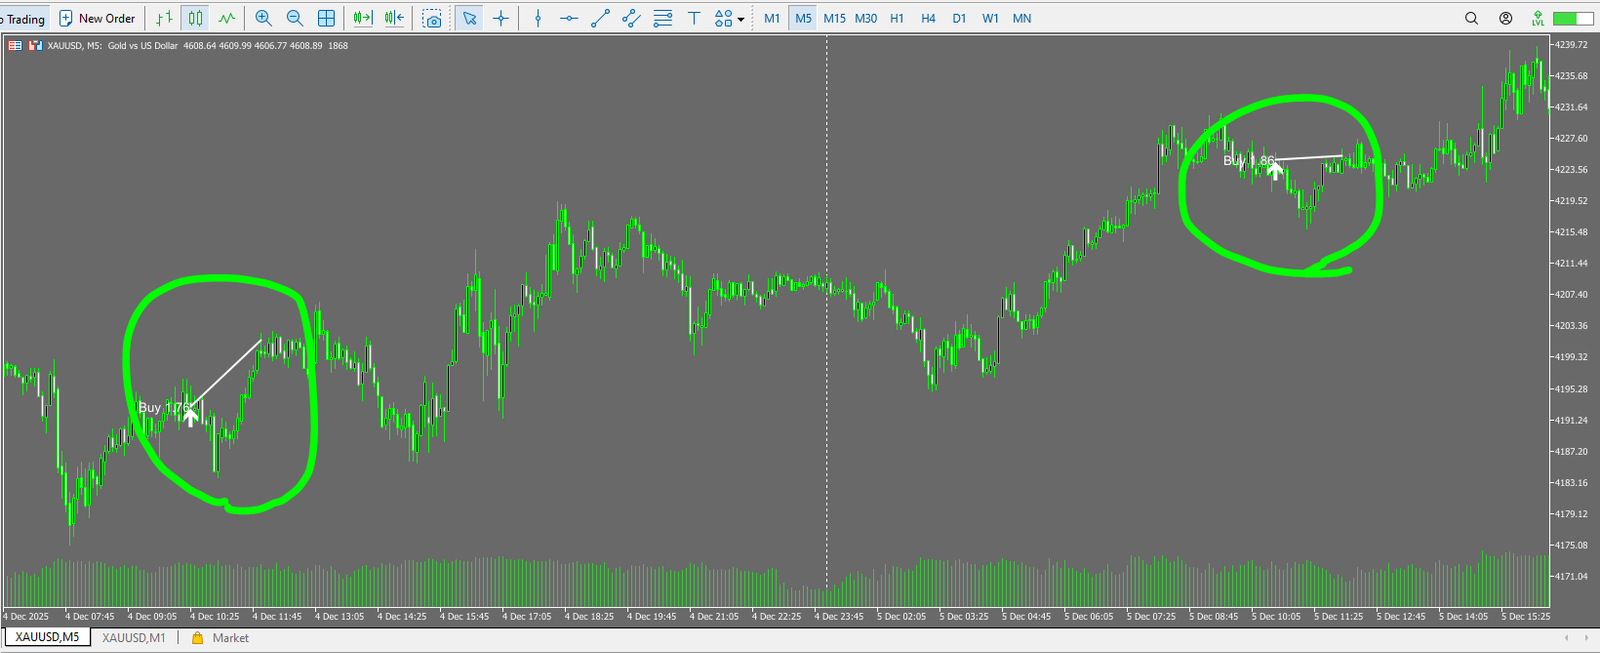
As also seen in the losing-trade example from the backtest, the EA appears to hold positions during adverse movement instead of cutting quickly. For scalping strategies, profits are typically small, so losses must be controlled early; otherwise the equity curve can break quickly. This is a potential weakness for CryonX EA.
With this structure, the win rate can look very high during calm periods, but during sudden moves, many small wins can be erased by a small number of larger losses. That is why the “shape of losses” matters more than the win rate itself.
Be cautious about overfitting (curve fitting)
Scalping with slow stop-outs can produce beautiful backtest curves, yet fail in live conditions due to spread variability, slippage, and feed differences. Because the backtest here looks “too perfect,” it is reasonable to treat overfitting as a serious possibility.
To strengthen confidence, it is important to check what happens after the forward trade count increases—especially maximum loss during losing streaks, how floating drawdown expands, and behavior during volatility spikes.
Practical operation notes
- Prioritize low-spread, low-latency execution (e.g., VPS)
- If slippage is large, the edge of tight-range scalping can disappear
- Even with a high win rate, slow stop-outs require extra caution for sharp spikes and fast trends
Overall, CryonX EA appears to aim for “scalping without dangerous methods,” but slow stop-outs can become the key risk factor. The current results look strong, yet the final verdict should be made only after more forward data and tougher real-world execution tests.
Overall Verdict & Summary (Provisional Review as of Jan 12, 2026)
In this article, I reviewed CryonX EA (Cryon X 9000 EA MT5) using both the publicly available MQL5 forward signal and my own backtest results. The conclusion is that it looks very attractive right now, but a cautious stance is justified given the short forward record and the “too perfect” backtest curve.
Positives (what can be credited as of today)
- A forward track record is publicly available on MQL5 Signals, so performance can be monitored
- Short-term forward stats look like very high win rate and small-looking drawdown
- The trade history does not strongly show classic grid/martingale patterns
- The backtest shows an extremely smooth upward curve over a long period
Risks & concerns
- The forward record is short and the trade count is limited, so statistical confidence is low
- The backtest curve looks too perfect, which raises overfitting concerns
- Because it appears to be a scalping style, results can depend heavily on spread, execution, slippage, and latency
- Despite scalping, the EA appears to have slow stop-outs and can hold positions in adverse moves
- Even with a high win rate, a small number of larger losses can damage performance quickly
Practical takeaway
- It is better to wait for a longer forward record before buying. Even if the price rises later, it can be worth accepting that trade-off rather than rushing a decision
- Focus less on win rate and more on how losses appear (max loss, losing streak tolerance, floating drawdown expansion)
- Because spread/slippage matter, keep an eye on future buyer reviews and real-world execution reports
Overall, CryonX EA looks very strong in both the backtest and the current snapshot, but it also carries two major uncertainties: a short/limited forward sample and slow stop-outs.
I have repeatedly seen this category of EA (tight-range scalping, very high win rate, slow stop-outs) perform well in short-term forward records, then collapse over longer horizons. This EA’s true strength can only be judged with time.
The tighter the profit targets and the slower the stop, the easier it becomes to overfit, and the easier it becomes to “look impressive” to users.
Therefore, as of today, I conclude that this is “promising, but an EA that should be judged only after careful, ongoing validation.”
No obvious grid/martingale-style behavior is visible. However, it is still a scalping EA with slow stop-outs, which can leave positions sitting in adverse moves. A single sharp spike can be dangerous. Because the stop is slow, short-term forward results may look strong “by design,” so caution is required. This EA may be over-optimized.