Can a breakout EA actually make money?

Based on my own testing conditions (explained later), I found that breakouts often make it easier to build a “small loss, big win” profile than mean-reversion strategies—so there may be a real edge in the right situations.
That said, results can change drastically depending on EA quality, market conditions, and trading costs.
In this article, I’ll walk through my test results using a sample EA, and explain the key pros and cons in a practical way.

What Is a Breakout EA?
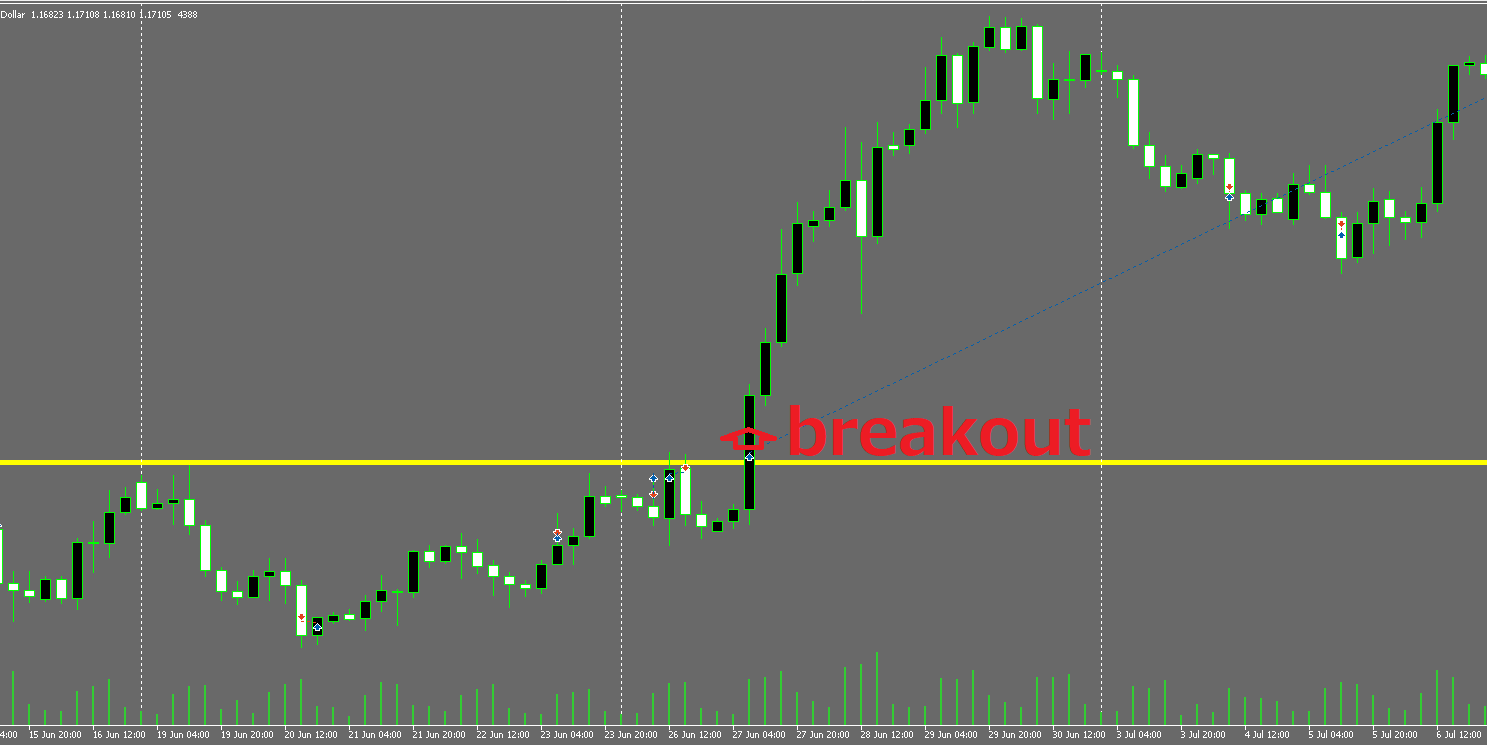
A breakout EA is an automated trading strategy that enters when price breaks above or below a recent high/low over a defined period (the top/bottom of a range). The goal is to catch momentum—when price escapes the range and continues moving in the same direction.
Instead of hesitating like a human trader (“Should I enter now…?”), the EA executes mechanically when price reaches a pre-defined level.
Related article: What Is an EA? A Complete Guide to Forex Automated Trading and How to Choose One
The core idea is simple: price stays stuck in a range for a while, then at some point it breaks out and begins trending in one direction.
In practice, orders tend to cluster near the range boundaries (high/low). When price finally pushes through that “traffic jam,” it can trigger a fast move as buy/sell pressure suddenly releases.
Another advantage is that the decision input is mostly price itself (new highs/lows), so rules often stay simple and easy to define.
How It Differs From Trend-Following EAs
Many trend-following EAs use tools like moving-average slope, or “pullback after breakout” patterns—meaning they often wait until a trend is clearly formed before entering.
A breakout EA, on the other hand, defines the “birth point” of a trend as the moment price breaks the range high/low. It often uses stop orders to mechanically capture the initial move right as price escapes the range.
Both are trend-direction strategies (buy in rising markets, sell in falling markets). The key difference is that breakouts use the moment “pressure releases” as the trigger.
- Entry timing: Breakout = early move; Trend-following = after confirmation (often waiting for a pullback).
- Main risk: Breakout = repeated fakeouts (price breaks, then snaps back); Trend-following = late entries that worsen risk-reward (R).
- Where the edge comes from: Breakout = order flow can become one-sided once price escapes the range; Trend-following = riding trends with proven continuation.
- Related:Do Trend-Following Forex EAs Work? Verified by Backtesting
Advantages of Breakout EAs
Easier to build “small loss, big win” (strong risk-reward)
A major strength of breakout strategies is that it’s often easier to keep your stop-loss close.
For example, with a rule like “buy when price breaks above the range high,” you can place the stop just below that breakout level. If the breakout fails, you exit quickly. If it’s a real breakout and price runs, you can let profits grow using a trailing stop.
That naturally creates the profile:
big gains on trend days / small losses on non-trend days.
This “small loss, big win” shape often makes weekly or monthly expectancy more stable.
Related:FX Trading Expectancy (EV) Explained: EAs, Win Rate, Risk-Reward & Money Management
Good match for compounding (auto-lot), with more upside during strong phases
Breakout EAs can sometimes catch large directional moves. Strategies like this often pair well with compounding (auto-lot / money management), where lot size increases with account balance. When things go well, growth can accelerate.
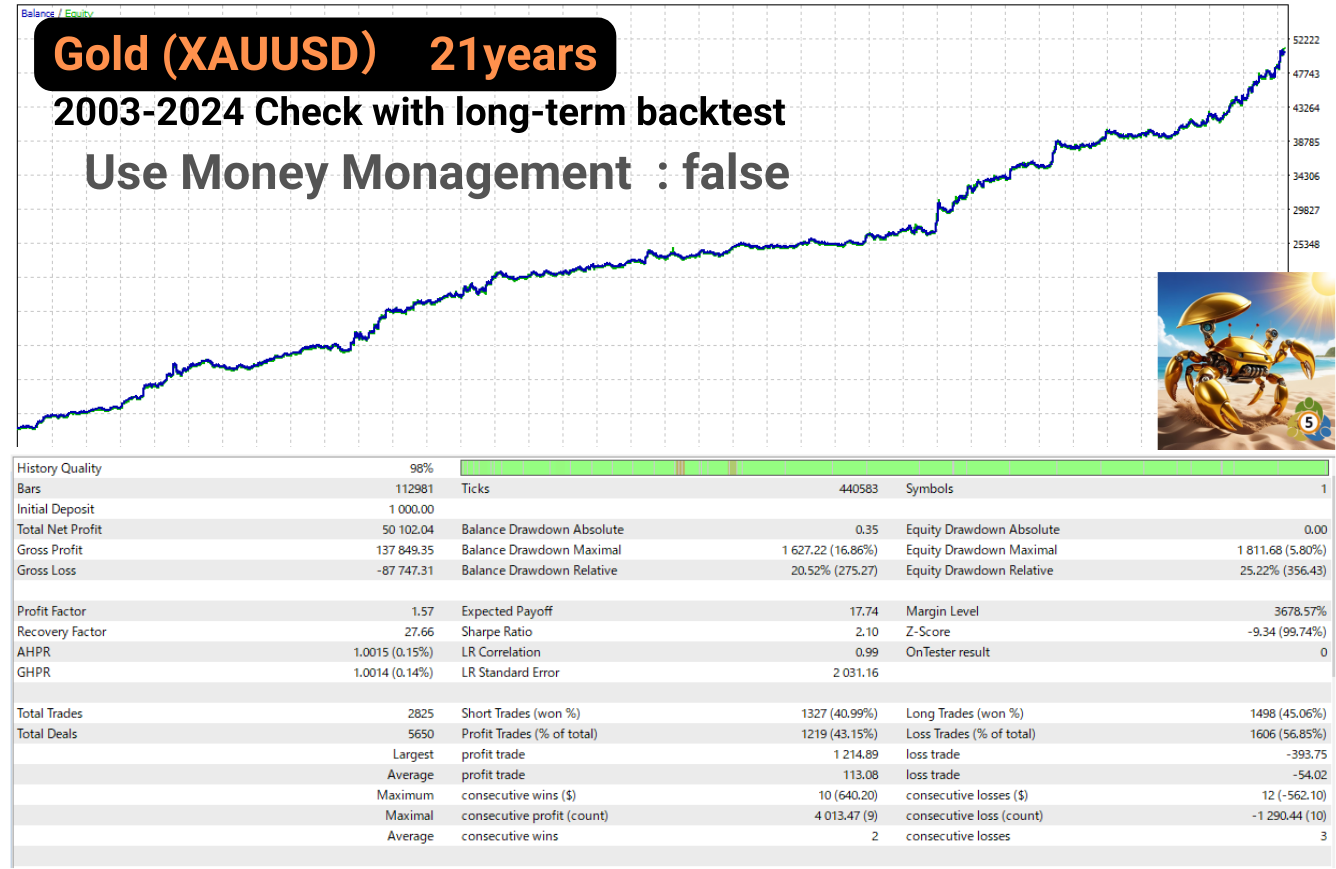
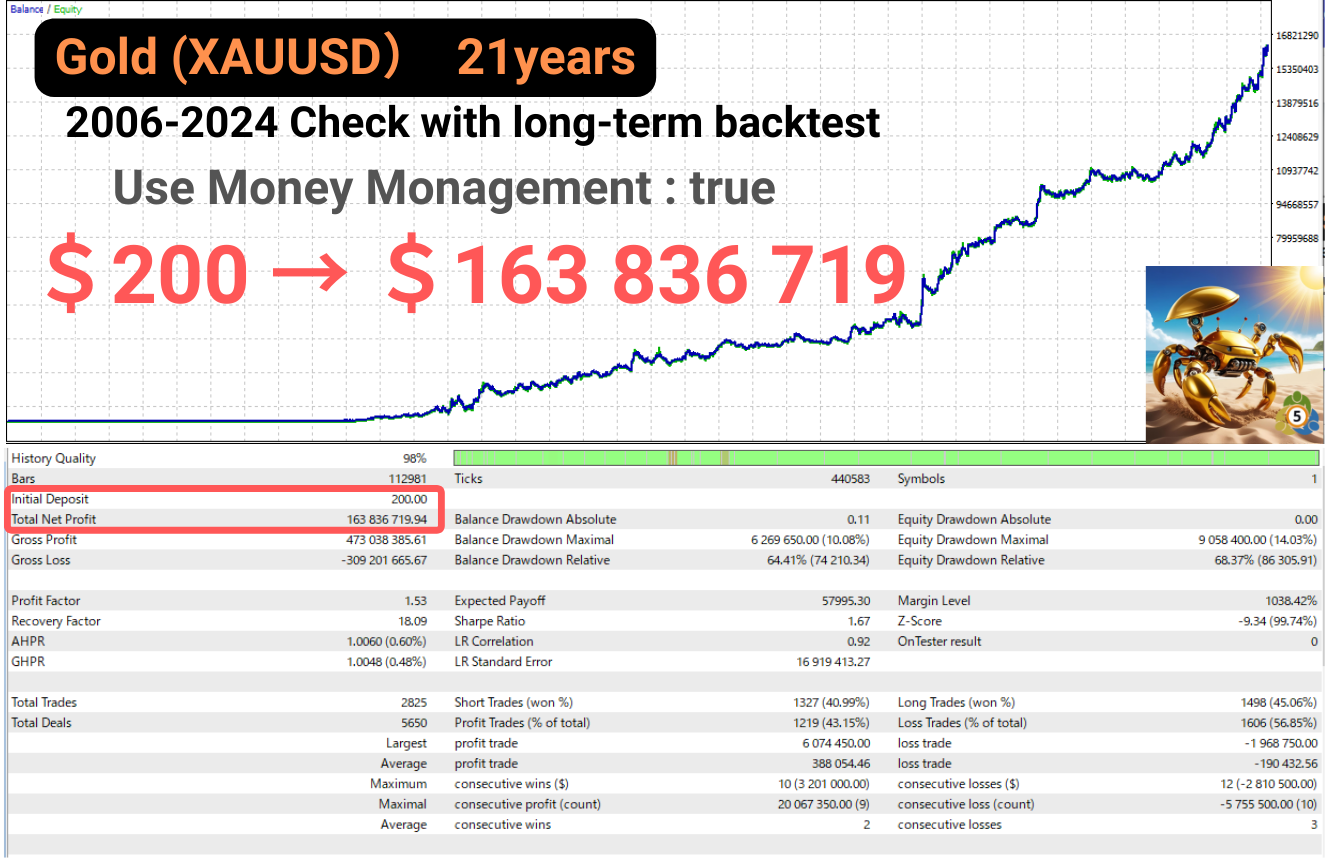
As an example, here are long-term backtests for Gold Crab Robot using fixed lot size vs. auto-lot (compounding).
Over a long operating period (around 20 years), the compounding mode can grow the balance far more.
However, compounding also tends to magnify losses, not just profits—so you need to be careful.
Also, compounding backtests often become unrealistic as lot sizes grow. Real trading rarely matches the same curve because of:
worse execution when liquidity drops, broker maximum lot limits, and psychological constraints in live trading.
So do not assume the backtest is guaranteed to repeat.
- Why compounding can “grow faster”: profits increase the balance, which automatically increases the next position size—so in strong markets, gains can snowball.
- Practical rule: If the EA supports auto-lot/compounding, turn it ON in backtests and check how large the maximum drawdown can get. Only run settings where drawdown stays within what you can tolerate. The key is to test it yourself.
- Related:EA Lot Size & Position Sizing: Fixed vs Auto Lot, Risk % Rules, and Starting Deposit Math
Stop-order based design can reduce downtime and delay risk
Breakout EAs often “ambush” with stop orders (buy stop / sell stop).
A big advantage is that entry orders and SL/TP can sit on the broker’s server. Even if your EA or VPS pauses temporarily, the orders can remain active.
That makes it easier to reduce unexpected damage when your PC/VPS/EA stops.
Related:MT5 EA Safety: Order Types, Server-Side SL/TP, Pending Orders, and Latency Risk
Simple logic is easier to test and reproduce
The core rule is often as simple as: “enter when price crosses a level.”
That keeps the system consistent and makes testing straightforward.
In live trading, spreads and slippage still matter—but because the logic stays simple, it’s often easier to connect:
backtest → live execution.
Also, fewer moving parts usually means a lower risk of severe curve-fitting (over-optimization).
Related:EA Overfitting (Over-Optimization): How to Detect It Before You Buy
Easier to keep robustness (sturdiness) over time
Based on the benefits above and the multi-symbol results shown later, breakout strategies often lend themselves to more robust EA designs.
Key points:
- Stop-order structure can reduce the risk of PC/VPS downtime
- Easier to build strong risk-reward logic
- Good results across multiple symbols can hint at broader usefulness (see next section)
- Simple rules can reduce the chance of extreme over-optimization
Related:EA Robustness Explained: How to Choose a Forex Trading Robot That Won’t Blow Up
Case Study With a Self-Built Sample EA: Does a Breakout EA Really Hold Up? (2005–2025)
To go beyond theory, I built a simple sample EA myself and tested a breakout strategy with long-term backtests.
In this section, I’ll summarize what the results suggest—and what you should watch out for if you want to use a breakout approach in real trading.
EA Design: Enter on breakout, manage exits only with % SL/TP/trailing
This EA enters when price breaks a recent high/low (range top/bottom), and manages exits using only percentage-based rules.
I kept it intentionally simple, and limited optimization to just four parameters:
- ① Lookback period for high/low (range length)
- ② Initial stop loss (%)
- ③ Take profit (%)
- ④ Trailing stop (%)
Test conditions: Symbol = EURUSD / Initial balance = $1,000 / Lot size = fixed 0.01 / Long period = 2005–2025.
Note: Breakouts are often “first-move strategies,” which makes them sensitive to spread, slippage, and execution quality. I’ll cover real-world cautions later in this article.
Key results (EURUSD / 2005–2025)
As a representative example, let’s look at the best-performing optimized result for EURUSD.
The main metrics to focus on:
- PF (Profit Factor): total profit ÷ total loss (above 1.0 means net profitable)
- DD (Drawdown): how far equity falls from a peak (directly impacts capital and psychology)
- Max losing streak: consecutive losses (useful for measuring fakeout tolerance)
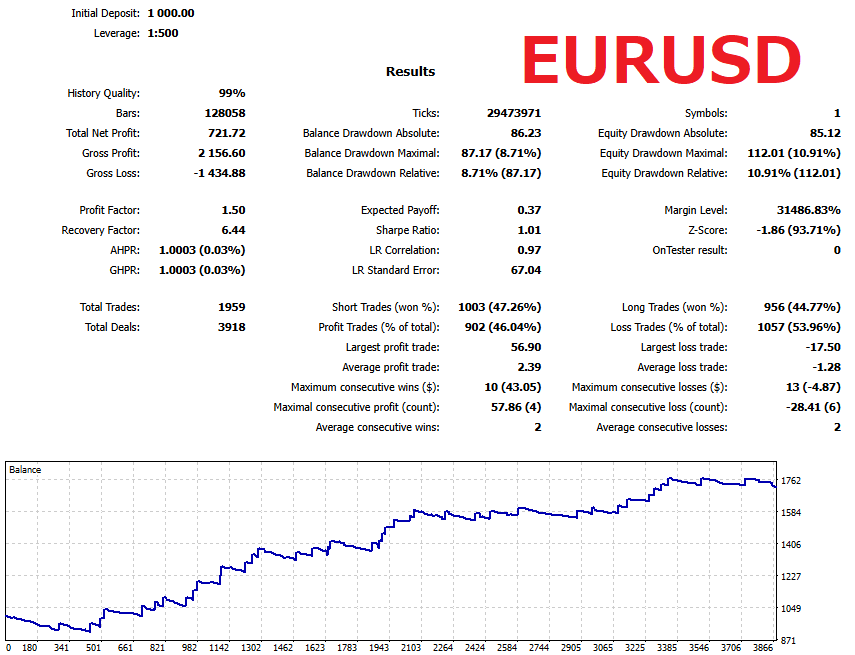
- PF = 1.50. Win rate is not high (about 46%), but average win 2.39 > average loss 1.28, so a risk-reward advantage (“small loss, big win”) is clearly working.
- Max losing streak = 13 (≈ -4.87). Fake breakouts are unavoidable, so your design must survive losing streaks if you want to trade this live.
- The curve trends up overall, but there is a flat/stagnant zone in the mid-to-late period. Managing low-volatility phases and “range re-compression” periods becomes a key challenge.
It’s fair to say: “You picked the best optimized result, so of course it goes up.”
That’s true.
The point here is different: even with only four parameters, the system naturally settles around PF ~1.5, and the “small loss, big win” shape seems relatively repeatable.
That may be because the core driver is a simple, universal factor: price breaking out.
Applying the same logic to major pairs + GOLD (cross-market test)
Next, I applied the same idea to major currency pairs and GOLD (XAUUSD).
The key takeaway is not “it works everywhere,” but that fit and misfit are very clear.
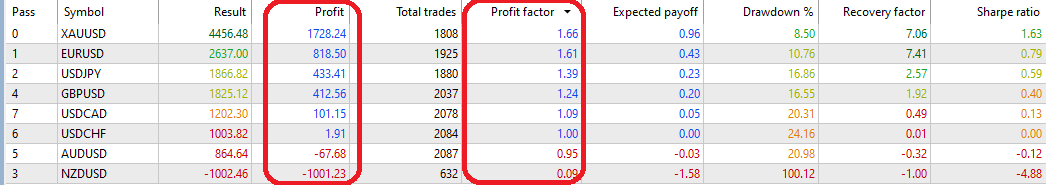
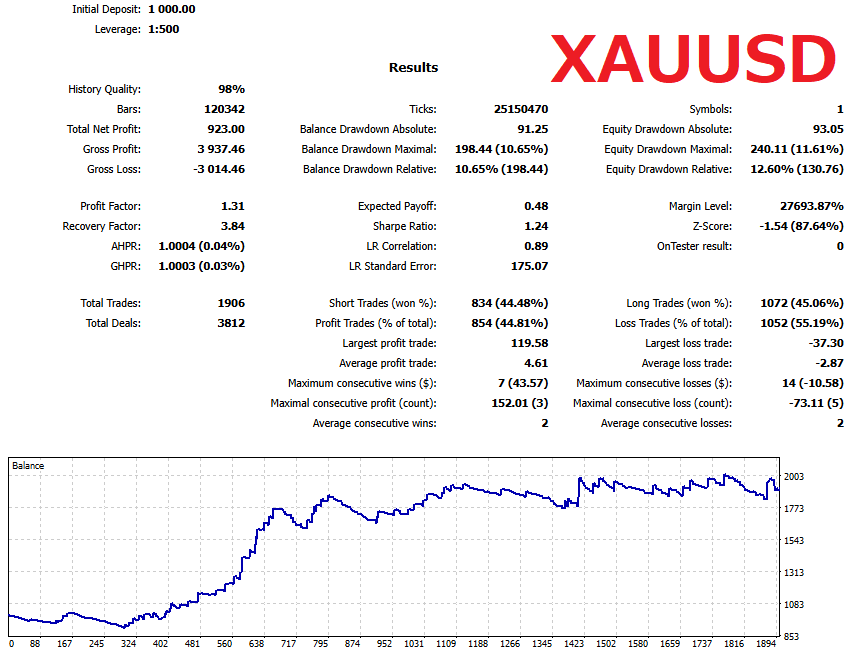
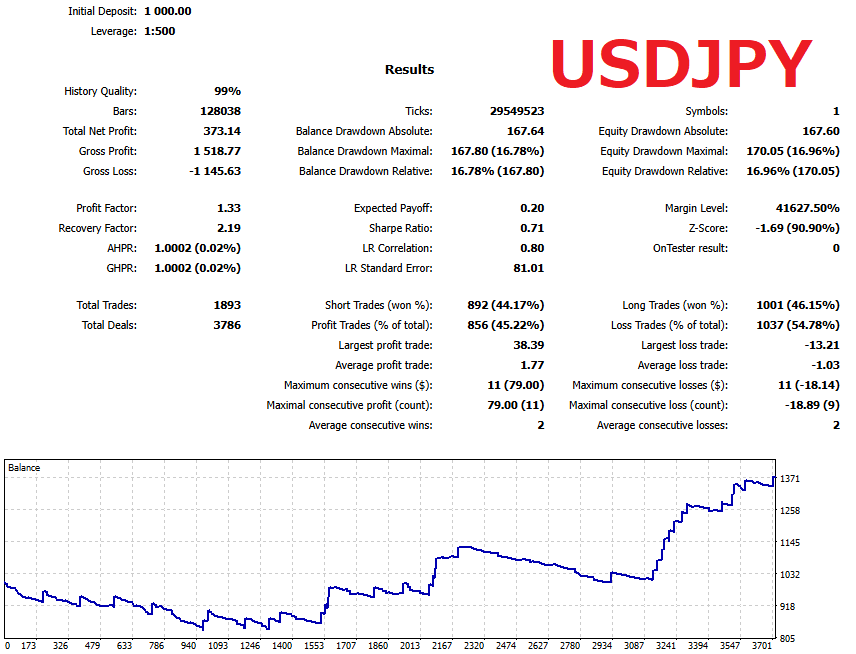
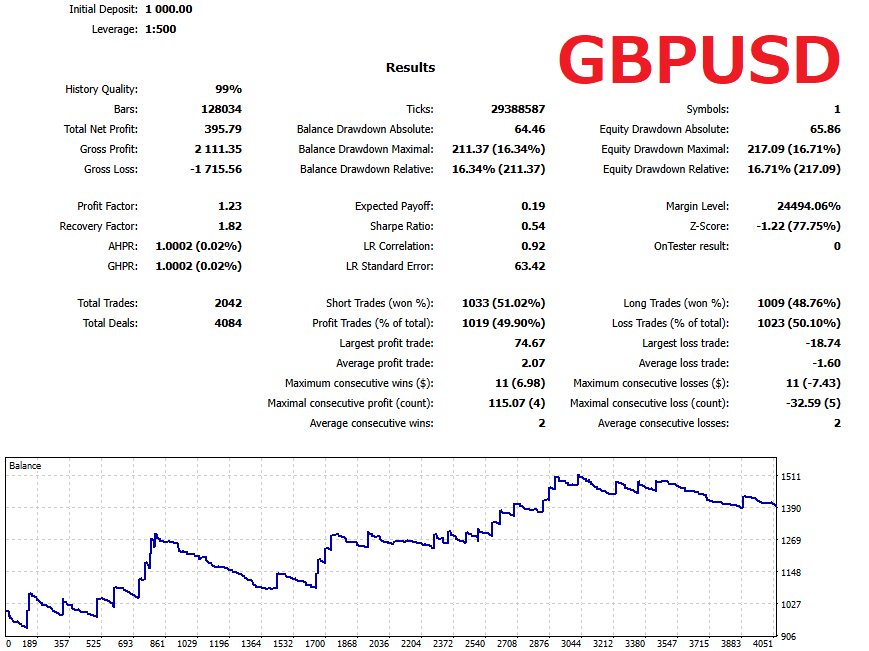
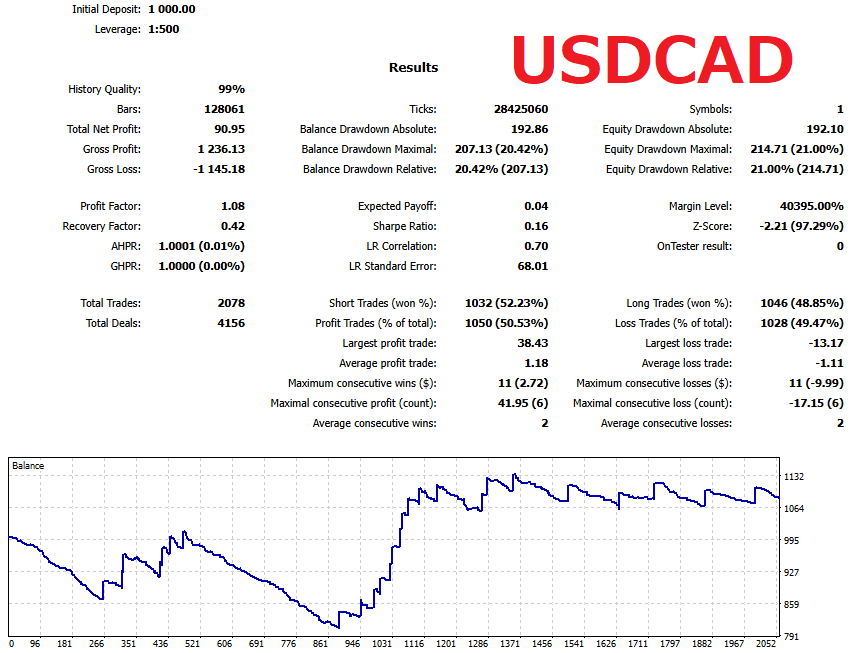
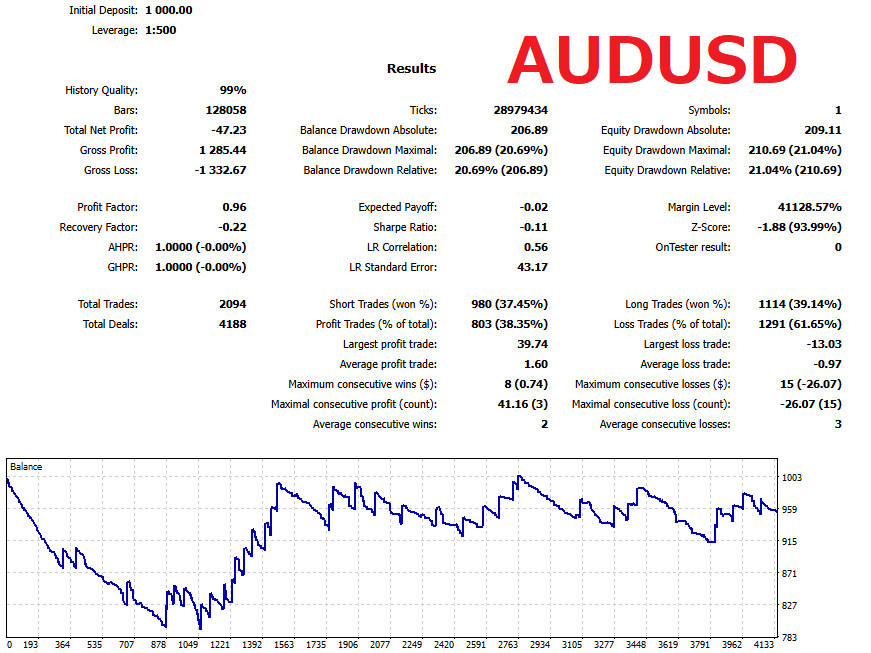
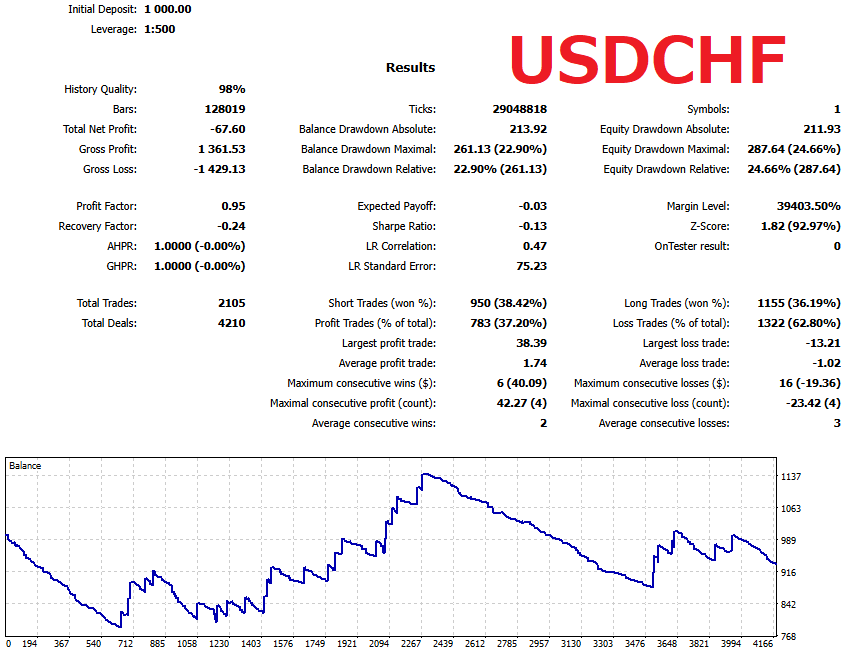
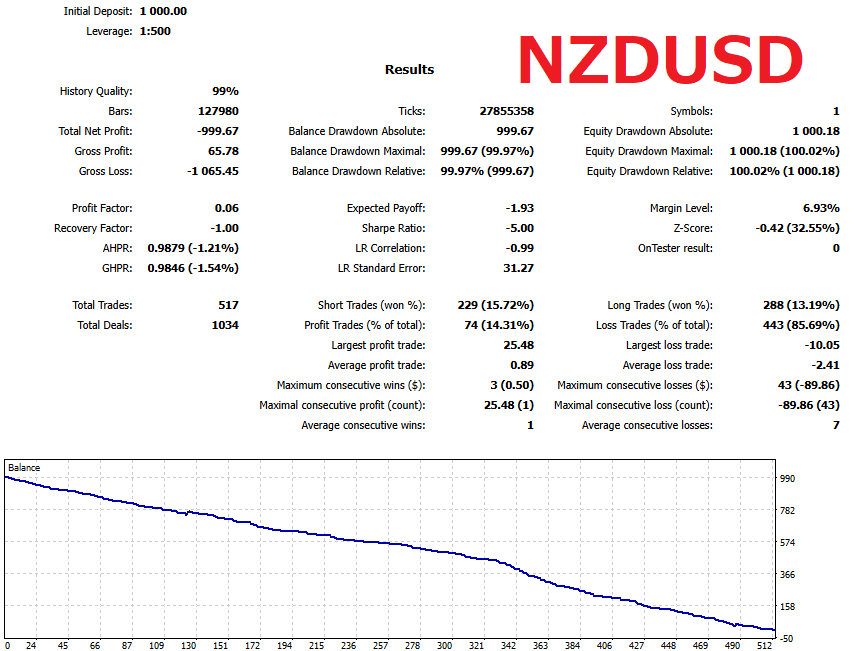
Conclusion: NZDUSD collapses and AUDUSD is weak, while EURUSD, USDJPY, XAUUSD (and to a lesser extent GBPUSD) show meaningful viability.
Even with only four parameters, the fact that the same trade logic can work reasonably across multiple symbols supports the idea that breakout logic has some general usefulness.
At the same time, it’s also valid to choose: don’t trade symbols with poor results (define what you will NOT trade).
How to interpret these results
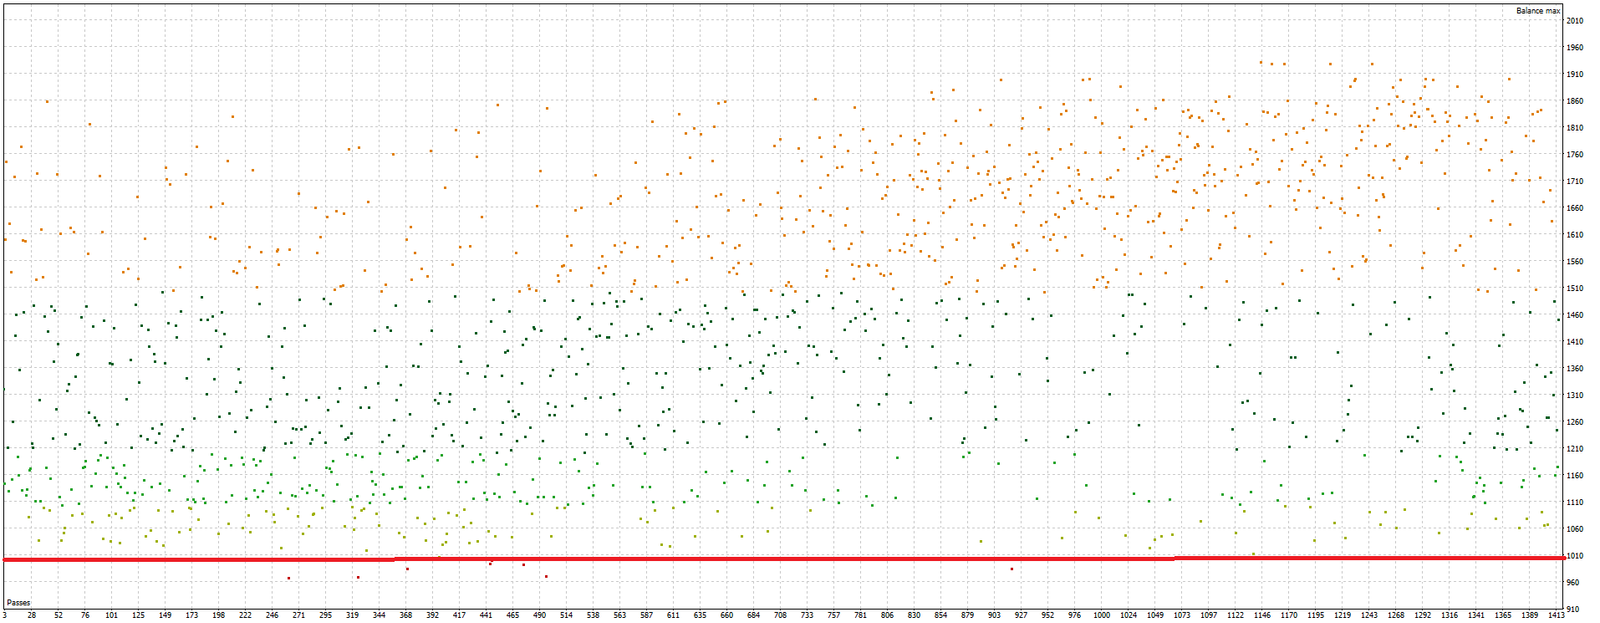
- Possibly lower parameter dependence: A wide profitable zone in the optimization distribution suggests the strategy may not collapse with small parameter changes. Still, market regime (volatility/liquidity) matters—so a time filter may be useful.
- Risk-reward advantage is working: Even without a high win rate, the system can maintain average win > average loss.
- Symbol fit is strong: Some markets (like NZDUSD here) can be consistently incompatible. A breakout EA does not work on every pair.
Examples of additional design ideas (possible improvements)
The following additions may improve results—but they are only “possible” improvements.
Adding too many conditions can also reduce performance, so test carefully.
-
- Time filter: Limit trading to London through early New York, and avoid low-volatility Asian hours.
- News policy: Default to avoiding major releases to reduce damage from spread widening. (But this can also reduce opportunities.)
- Multi-symbol diversification: Spread trades across multiple symbols. However, more symbols can also increase drawdown risk. You must manage max simultaneous positions and account risk % per trade. Also note: breakout strategies often depend on volatility. During prolonged low-volatility regimes (e.g., 2018–2019), many pairs can stagnate at once, and diversification can become a risk if everything draws down together.
Even with the ever-present risk of optimization bias, the fact that a simple logic can still produce generally decent results supports the idea that breakout logic itself may contain an edge.
Drawbacks and Risks of Breakout EAs
Lower win rates are common — and that can be mentally stressful
Many breakout EAs are designed to lose small and win big.
That often results in a medium-to-low win rate (you may even lose more often than you win for long stretches). Losing streaks and temporary drawdowns are part of the package.
In practice, what breaks traders is often not the “logic,” but the psychology.
A good habit is to run your own backtest and confirm whether live behavior matches the backtest.
Even if the long-term curve rises, short windows can include frequent flat phases and drawdowns.
If your backtest already shows losing streaks and drawdown phases, then when they happen live you can treat them as “expected behavior,” and focus on whether long-term expectancy remains intact.
Making “healthy losses” visible is important.
However, if drawdown becomes larger than expected, or stagnation lasts longer than expected, you should consider pausing the EA.
Set a stop rule in advance, and fund the account with only what you can afford to lose.
Related:Stop Chasing Win Rate: How to Evaluate Forex EAs with Expectancy, Risk-Reward & Drawdown
Highly sensitive to spread, slippage, and execution delays
Breakouts aim to capture the first move right after the range breaks.
That makes execution quality critical.
Even if backtest results look strong, live trading can be worse due to:
- Spread widening (especially near market open or around news)
- Slippage (fills worse than intended)
- Execution delay or rejection (common during fast moves)
This can cause entries to degrade and live results to underperform backtests.
A safer approach is to backtest using pessimistic cost assumptions (worse-than-expected conditions),
and confirm that expectancy remains positive even after adding spreads/commissions.
Related:MT5 EA Trading Costs Explained: Spread, Commission, Slippage & Swap (Backtest vs Live Reality)
Breakout EA Characteristics: Market Fit
Volatility-dependent: low-volatility phases often lead to stagnation
Breakout EAs tend to perform better when the market moves strongly (high volatility), because breakouts happen more often and follow-through is stronger.
When price action is small, breakouts occur less often—and even when they happen, they may fail to run.
So performance often stalls.
Markets naturally alternate between active and quiet phases.
If low volatility persists, it can be realistic to:
reduce exposure (trade fewer hours, lower lot size, or pause the EA).
Some symbols and time windows fit better (e.g., London to early New York)
Breakouts tend to occur more often—and extend further—when liquidity increases.
A typical high-liquidity window is the London open through early New York.
A common daily pattern is:
small Asian-session range → increased participation at Europe open → breakout and trend.
Time filters can reduce low-quality trades.
News spikes are both opportunity and risk
Major economic releases and central bank headlines can create sudden volatility, which may look like a breakout opportunity.
But they also increase:
- Spread widening
- Slippage
- Order rejection or very unfavorable fills
It’s a double-edged sword.
You need a consistent policy: avoid news or trade news intentionally.
Either can be valid—but don’t switch based on emotion.
Decide after testing (tick-based tests if possible) or via small-lot forward trading.
Practical Settings and Operating Tips
① Define what counts as a breakout
Common definitions include:
- High/low of the last N bars
- Range width over a fixed period
- ATR-based levels (Average True Range as a volatility benchmark)
The key is to define it numerically.
② Place the initial SL where you can clearly say “breakout failed”
If you keep holding and hoping after a failed breakout, you lose the strategy’s biggest advantage.
Keep the initial stop relatively small and place it where:
“If price returns here, the breakout is invalid.”
For example:
“If price fully returns inside the range, the breakout failed.”
③ Use trailing stops so winners can run
Breakout systems often make most of their profit on the days when price trends strongly.
So instead of taking profit too early with a fixed TP, a trailing stop often fits better.
On non-trend days, accept the small SL loss and move on.
④ Validate in two steps: backtest + forward test
Because breakouts are sensitive to spread and slippage, don’t stop at backtests.
- Backtest: Confirm the strategy survives even under pessimistic assumptions (wider spreads, slippage, commissions).
- Forward test: Run minimum lot size for a fixed period (e.g., 30–90 days) and compare it to the backtest for the same time window. Confirm there is no major divergence.
Common Mistakes and Fixes
- Mistake: Quitting due to losing streaks and a low win rate
→ Fix: Use backtests to measure max losing streaks and expected drawdown (size and duration). Confirm whether live losses are “within expectation.” Also remember: don’t blindly trust backtests. - Mistake: Over-optimizing until the system collapses (curve-fitting)
→ Fix: Don’t increase the number of optimized parameters too much. If you buy a third-party EA, check forward performance too. - Mistake: Backtest looks good but live trading performs poorly
→ Fix: Backtest the exact same period and compare. If backtest wins but live loses, suspect spread widening and slippage first.
Who Breakout EAs Are Best For
- People who can prioritize risk-reward over win rate
Breakout EAs can lose repeatedly during fakeout periods. If you can focus on long-term expectancy over short-term “feel-good” wins, you’re a better fit. - People who can keep trading by the rules through drawdowns
You must accept “planned losses” calmly. If you stop the EA or constantly change settings midstream, you often break the edge you tested. - People who want to start with a small account
Losing streaks still happen, but unlike grid/martingale styles, it’s often easier to cap risk per trade. That makes it more practical for small balances. - People interested in compounding (auto-lot)
Breakouts can benefit from strong trend phases, so compounding can fit well. But compounding also magnifies drawdowns—so you need a stop rule and should fund the account with only your risk budget.
Summary: Breakout EAs Are Trend Strategies That Win by Following Rules Over the Long Run
A breakout EA is a simple, repeatable trend strategy that tries to capture the initial move after price breaks above/below a recent high/low.
Its strengths:
- Stops can often be placed relatively tight
- Strong moves can deliver large wins (a “small loss, big win” profile)
Its weaknesses:
- Losing streaks caused by fake breakouts
- Performance degradation in live trading due to spread, slippage, and execution quality
The fastest way to survive with a breakout EA is not chasing a perfectly smooth equity curve with no drawdowns.
It’s committing to the process:
follow the rules over a long time horizon and keep operating consistently.
EA quality varies, but at minimum, breakout strategies are fundamentally different from “built-to-break” designs like extreme martingale or infinite averaging-down systems.
If you test carefully and execute consistently, breakouts can become a real weapon.
FAQ: Common Questions About Breakout EAs
- Q. Doesn’t a breakout EA end up as pure luck?
- A. It can look random, but it’s not purely gambling. Breakout trading builds expectancy by losing small and winning big. The key is whether average win > average loss holds over the long run, and whether expectancy remains positive even after realistic costs (spread, slippage, commissions).
- Q. If performance stalls, how should I decide what to do?
- A. Stagnation is common in low-volatility phases. The decision point is whether the stall is “within expectation.” Use backtests to estimate expected stagnation duration and expected drawdown. If you exceed those thresholds, consider pausing, reducing lot size, or reviewing conditions. Treat backtests as best-case references, and assume real DD/stagnation can be larger. Limiting deposits to your risk budget also helps psychologically.
- Q. What should I do when fake breakouts cause long losing streaks?
- A. First accept that losing streaks are part of the design. Options include: (1) reduce lot size so you can endure the streaks, (2) use a time filter to avoid low-volatility hours, and (3) set a stop rule (e.g., pause if DD exceeds the expected level). Avoid emotional parameter changes—check whether the losing streak is still “within expectation.” If it is, doing nothing can be the best choice.
- Q. Why can backtests win while live trading loses?
- A. Breakouts often depend on the initial move, which is highly sensitive to spread widening, slippage, and execution delays in live markets. Backtest with pessimistic assumptions and run a minimum-lot forward test. Compare the forward results to the backtest for the same period and confirm there’s no major divergence.
- Q. Which sessions work best? Is the Asian session always bad?
- A. In general, London open through early New York tends to produce more breakouts and stronger follow-through because liquidity increases. The Asian session is often quieter and can lead to stagnation or failed breakouts. That said, it’s not “always bad”—it depends on the pair and broker conditions. Confirm with forward testing and then decide your time filter.
- Q. Should I avoid news, or try to trade it?
- A. Either can be valid. News can create big moves, but also causes spread widening, heavy slippage, and order rejection. If you trade news, validate with a minimum-lot forward test and then keep the rule consistent.
- Q. For beginners, is fixed lot safer than compounding (auto-lot)?
- A. Fixed lot is usually safer. Compounding can grow quickly in good phases, but it also magnifies drawdowns and can produce unrealistic exposure. If you use compounding, test it yourself and set clear stop rules. Also fund the account with only your risk budget.
- Q. Can the same breakout logic work on all currency pairs?
- A. No. In this case study, some symbols worked reasonably well (e.g., EURUSD, USDJPY, XAUUSD), while others were clearly incompatible (e.g., NZDUSD). Breakouts are heavily affected by market behavior (volatility, trend characteristics, spread profile). Backtest per symbol, then verify the best candidates with a minimum-lot forward test.