
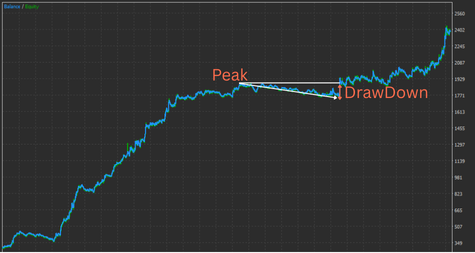
What Is Drawdown (DD)?
Drawdown (DD) shows how far your account equity has dropped from its most recent peak.
It’s not “how much you lost on one trade.” It’s a way to measure the largest dip you experienced during a run.
Drawdown is not just “loss” — it reflects how resilient your account is
An Expert Advisor (EA) builds an equity curve by repeating wins and losses.
What matters is not only how much it makes, but also how deep it can sink in a bad stretch (=DD).
The larger the drawdown, the harder it becomes to keep trading — both mentally and operationally (e.g., deciding whether to stop or reduce size).
Also note: as explained later, chasing a “zero drawdown strategy” can actually be dangerous.
Drawdown is not automatically “bad.”
If you want to survive long-term, you need to understand drawdown, define what you can tolerate, and manage it.
Related: What Is a Forex EA (MT4/MT5)? An Automated Trading Guide
What Is Maximum Drawdown (Max DD)?
Maximum drawdown (Max DD) is the largest peak-to-trough drop within a given period.
It’s usually shown in two forms — and both matter:
- Amount (e.g., USD)
- Percentage (%)
Balance Drawdown vs. Equity Drawdown: what’s the difference?
There are two major types of drawdown: Balance and Equity.
They mean different things, so mixing them up leads to bad risk decisions.
- Balance Drawdown
This reflects drawdown based on realized P&L (closed trades) only.
Even if you’re sitting on a large floating loss, it won’t show up in Balance until you close the trade — so risk can look smaller than it really is. - Equity Drawdown
This includes unrealized P&L (open trades).
For example, if your balance is $1,000 but your floating loss is -$300, your equity is $700 — that’s a 30% drawdown in real terms.
If you want to measure “account survival risk,” Equity drawdown is usually the priority.
Next, we’ll break drawdown into depth, duration, and frequency so you don’t judge a system by “one number” alone.
The 3 Dimensions of Drawdown: Depth, Duration, Frequency
If you only look at Max DD (USD or %), you can misread how hard a strategy is to run.
In practice, breaking DD into depth, duration, and frequency makes your evaluation much more accurate.
Depth: how deep did it drop? (Depth)
Depth is the percentage drop (%) from the peak to the trough.
In general, deeper DD makes position sizing, stop decisions, and account management much harder.
Duration: how long did recovery take? (Duration)
Duration is the time needed to recover back to the previous peak.
You can measure it in days, and for EA trading, it also makes sense to count number of trades.
Even a shallow DD can feel brutal if it lasts a long time — it often leads to “this thing is always losing,” and people stop too early.
Frequency: how often does it happen? (Frequency)
Frequency describes how often drawdowns occur or whether they happen in clusters.
Even with the same Max DD, an EA that draws down frequently tends to be mentally exhausting and increases the odds you quit mid-run.
“It looks like no drawdown” does NOT mean it’s safe
Many traders chase EAs that look like they “never lose” — meaning very small drawdowns.
But it’s risky to believe that “the best system has zero drawdown.”
FX price movement is complex and inherently irregular.
No strategy wins across every market regime (range, trend, sudden spikes, etc.).
So if a backtest or short forward test shows almost zero drawdown, you should question the “why” — and consider the risk of eventual failure.
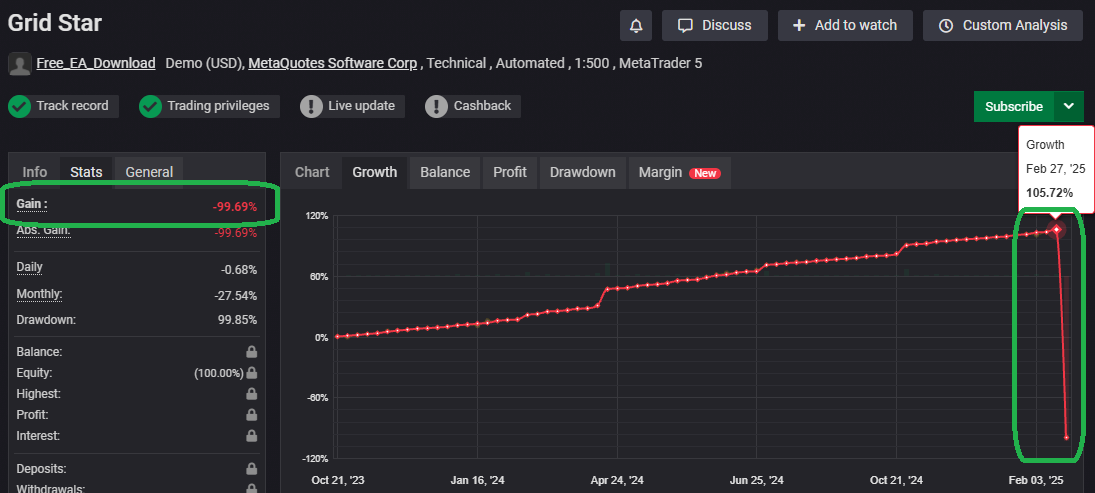
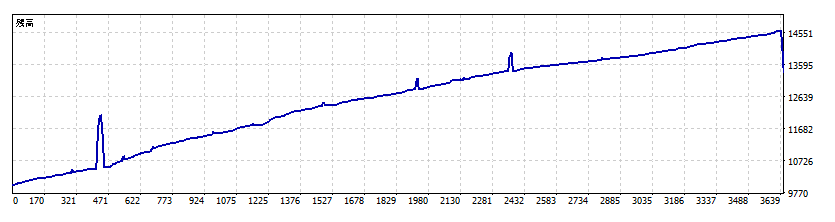
Grid (averaging down) / Martingale: one hit can blow up the account
Grid and martingale EAs are structurally prone to very large drawdowns.
They can look like they have “no drawdown” until the blow-up event finally hits.
A grid (averaging-down) EA keeps adding positions until price comes back.
That can create a high win rate and a smooth-looking curve in the short run.
But during a strong trend, floating losses can explode, and equity can collapse toward zero.
The example below looks like a clean uptrend with almost no drawdown — until it suddenly crashes near the end.
This is the classic pattern: small gains most of the time, then one fatal move against you.
Martingale increases lot size after a loss (often doubling).
A losing streak can make position size explode, leading to catastrophic drawdown.
Even if the short-term curve looks clean, the long-term failure probability tends to be high — so it’s generally best avoided.
Related articles:
Why Grid Forex EAs Blow Up: Hidden Drawdowns + Red Flags (Self-Made EA Test)
Martingale EAs: Why They Blow Up (Backtest Proof + Checklist)
Overfitting: “perfect” in backtests, breaks in real trading
When a strategy is overfit to past data, a backtest may show tiny DD or almost no losing periods.
But live trading includes market noise, costs, and execution friction (spread, slippage, rejects), so assumptions break — and results can collapse quickly.
Related articles:
What is EA overfitting? How to detect it and a pre-purchase checklist
Extreme “small wins, big losses” + long holds: the “small gains, one big wipeout” trap
Strategies that delay or avoid stop-losses can look great short-term:
high win rate, steady gains, and small-looking drawdown.
But they often suffer from the classic trap: many small wins, then one big loss that erases everything.
A backtest or short forward test may make DD look small, which feels attractive.
But over the long run, these strategies can turn negative.
Don’t rely on the “DD looks fine” impression — check whether the strategy has a real positive expectancy (EV) over time.
Related articles:
» Stop Chasing Win Rate: How to Evaluate Forex EAs with Expectancy, Risk-Reward & Drawdown
» FX Trading Expectancy (EV) Explained: EAs, Win Rate, Risk-Reward & Money Management
You also need to accept drawdown
Drawdown isn’t “evil.” In fact, healthy EAs often have drawdowns.
The reason is simple: when the market moves against the strategy’s thesis, a well-designed system limits damage with a Stop Loss (SL).
On the other hand, strategies that hate DD and keep pushing losses forward (or hold large floating losses) may look like they have low DD in the short run.
But in many cases, the risk didn’t disappear — it just moved into a less visible place (floating loss).
Drawdown is a “cost of survival”: cut losses and stay in the game
To survive on a live account, you must assume the market keeps changing.
The goal isn’t “no losses.” The goal is to avoid fatal damage and keep risk within a range you can continue trading.
- What to do: Don’t chase zero DD. Design and manage risk so DD stays within your tolerance.
- What to watch: Not only Max DD (%), but also depth, duration, frequency — and especially Equity DD.
- The goal: Accept DD within reason and grow equity over the long run with a strategy that has a real edge.
In the end, what matters is not “no drawdown,” but being able to withstand drawdown — meaning your account survives.
Accept DD within a rational range, stick with a real edge, and aim for long-term growth.
How to Read Drawdown in an MT5 Backtest Report
In MT5 Strategy Tester, drawdown (DD) is shown for both Balance and Equity.
Your first step is to understand what each item actually measures.
The 3 DD metrics: Absolute / Maximal / Relative
In the MT5 report, Balance and Equity each show three main drawdown types:
- Absolute: Measures how far the account dropped below the Initial Deposit. If it never drops below the initial deposit, this can look small.
- Maximal: The largest peak-to-trough drop (shown in both money and %).
- Relative: The largest percentage drop (shown in both % and money).
Note: the largest money drop and the largest % drop don’t always happen at the same time.
That’s why it’s safer to check both Maximal and Relative together.
Which DD matters depends on your lot sizing: auto-lot vs fixed lot
Even with the same EA, drawdown “means” something different depending on how position size is set.
Below, we test a self-built sample EA under the same conditions using auto-lot (compounding) vs fixed lot, and explain which DD metric you should prioritize.
Test conditions (same for both)
- Symbol: EURUSD
- Initial balance: $3,000
- Comparison: auto-lot (auto-lot/compounding) vs fixed lot (e.g., 0.1 lot)
For auto-lot (compounding), the key metric is “% drawdown”
With auto-lot, lot size increases as account balance grows.
In that case, money-based drawdown (USD) alone is not a fair way to compare risk.
The reason is simple:
once your balance grows, the same strategy naturally produces bigger swings in dollar terms.
So DD in USD gets inflated by account size, which makes it harder to judge whether your risk setting is truly reasonable.
That’s why the most important metric for auto-lot is Equity Drawdown Relative (%).
It answers this practical question:
“With this auto-lot risk setting, what is the worst % drop in equity?”
- Metric to prioritize: Equity Drawdown Relative (%)
- How to read it: “With this auto-lot coefficient (risk setting), equity dropped by up to XX% at worst.”
- Key point: judge resilience by %, not by money
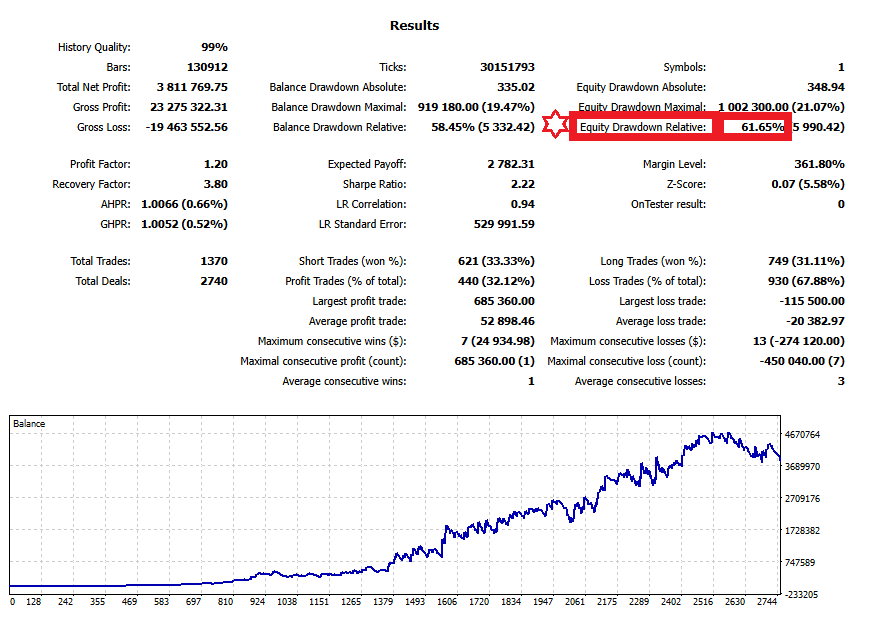
For example, in the auto-lot test above, Equity Drawdown Relative is 61.65%.
That means at some point, your equity fell by up to 61.65% from its peak.
Even if profit looks impressive, a 60%+ peak-to-trough drop can be very hard to live through.
If DD is too large in testing, consider lowering the lot coefficient (risk parameter) to reduce position size.
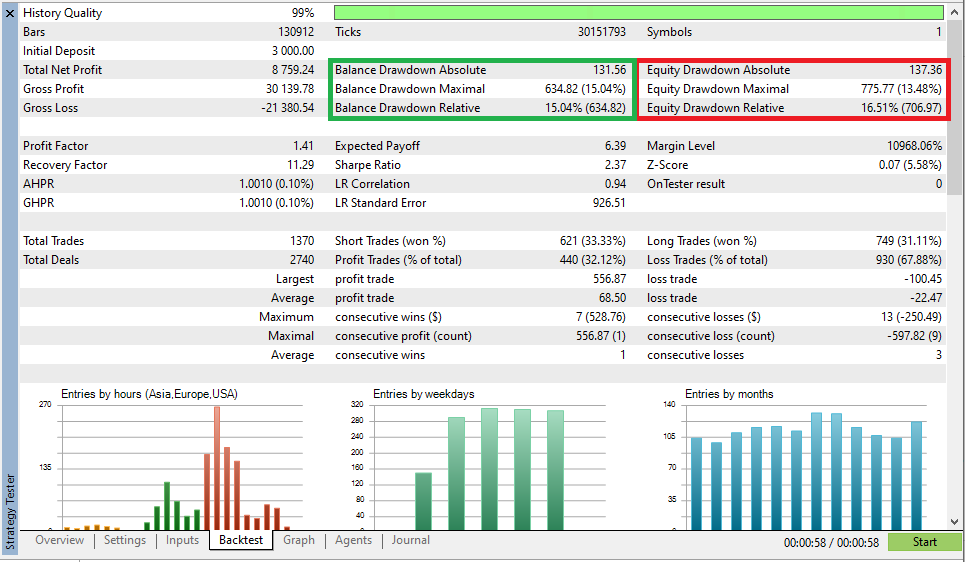
For fixed lot, money-based “Max DD” is clearer and easier to scale
With fixed lot (e.g., 0.1 lot), position size stays constant.
Drawdown tends to scale roughly in proportion to lot size.
MT5 will still show % drawdown, but for fixed-lot evaluation, relying only on % can be misleading.
In practice, it’s usually easier to reason in USD.
The first number to prioritize is Equity Drawdown Maximal (USD).
This is the biggest peak-to-trough drop in money terms.
- Metric to prioritize: Equity Drawdown Maximal (USD)
- How to read it: “With 0.1 lot, the worst-case drop is about XX USD.”
- Key point: you can estimate DD for other lot sizes by simple scaling
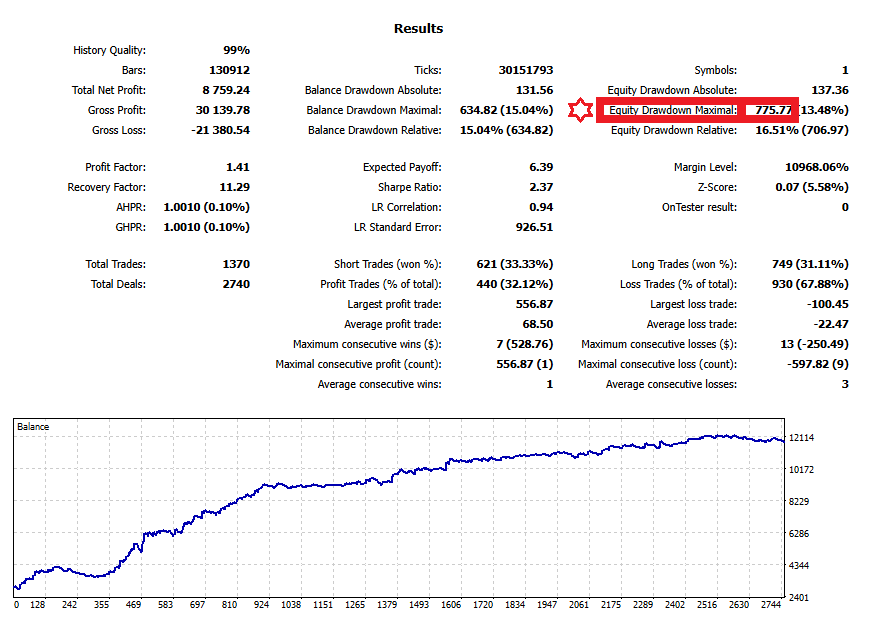
For example, if Max DD is $775 at fixed 0.1 lot, then roughly:
- 0.1 lot → about $775
- 1.0 lot (10×) → about $7,750
With fixed lot, it’s often easiest to decide your maximum tolerable loss in USD first, then work backward to the appropriate lot size.
Summary: which DD should you focus on?
- Auto-lot (compounding): use Equity Drawdown Relative (%) (focus on resilience by setting)
- Fixed lot: use Equity Drawdown Maximal (USD) (scale risk by lot size)
Use the “gap” between Balance and Equity to spot hidden risk
EA risk shows up in Equity, because Equity includes floating P&L.
A practical way to read it is:
- Balance drawdown: based on closed trades (realized losses)
- Equity drawdown: includes open trades (floating loss) — directly tied to survival risk
If Equity DD is clearly larger than Balance DD, the system may be carrying large floating losses while looking “fine” on the surface.
This is where you catch the “looks profitable, but actually underwater” type of EA.
Important: HTML backtest reports may not reflect Equity drawdown
MT5 HTML backtest reports usually show a chart based on Balance.
But the real risk often appears in Equity, because Equity includes floating loss.
So if you only look at the HTML chart, you may underestimate risk.
If only an HTML report is available, always check the numbers — especially Equity Drawdown Maximal and Equity Drawdown Relative.
Below is the same test, but the HTML chart and the MT5 chart look very different.
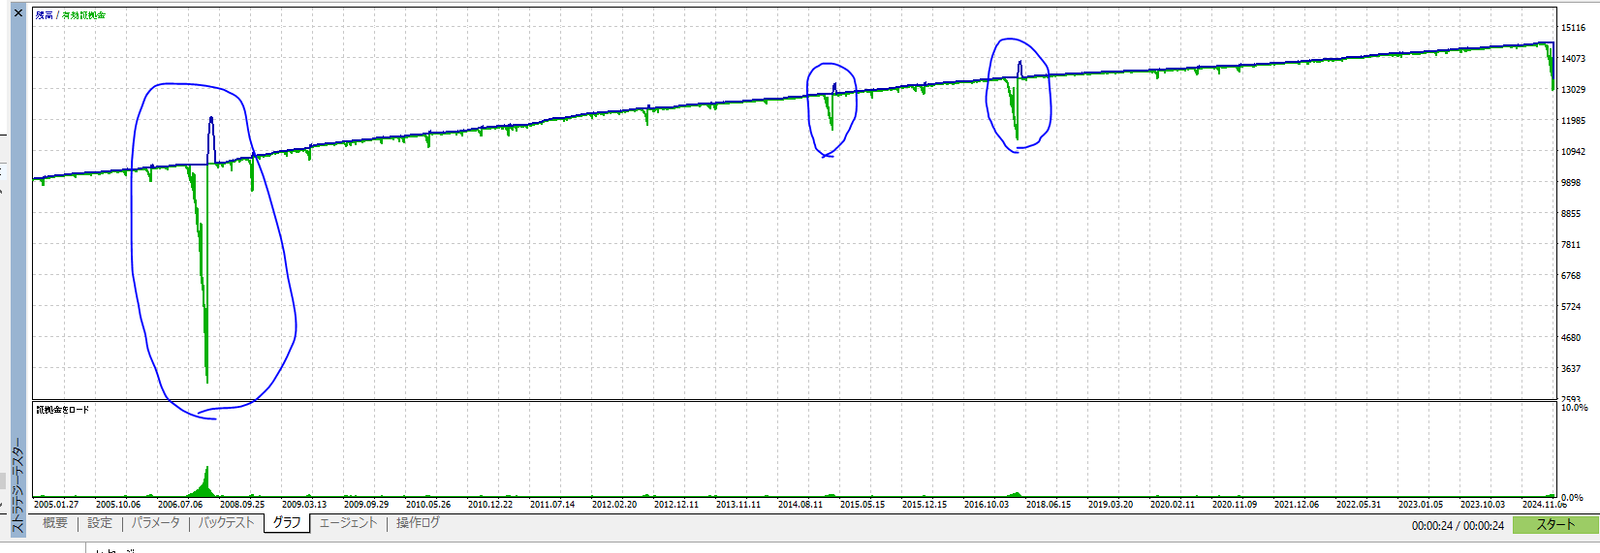
In short, charts are only an “entry point.”
For a final decision, you should confirm Equity drawdown in the report numbers.
Related: How to Read MT5 Backtests: Verify EA Risk with Equity DD & Orders/Deals
Max Drawdown and Risk Tolerance: How to Set a “Stop Line” with Numbers
Maximum drawdown (Max DD) is the worst drop you could face during operation.
The key isn’t to chase an EA with the smallest DD — it’s to decide how much DD you can realistically tolerate before you start.
This section explains a simple, practical way to set that tolerance using numbers — not feelings.
First: what is a tolerance line?
A tolerance line is basically:
“If it drops this far, I stop or reduce size.”
Without this line, you’ll likely panic when DD hits and make inconsistent decisions — late exits, impulsive size changes, or quitting at the worst time.
- Tolerable DD (%): the maximum % drop you can accept from peak (e.g., 30% / 50%)
- Tolerable DD (USD): the maximum money loss you can accept (especially useful for fixed-lot trading)
Step 1: Estimate “expected DD” from tests
Start by checking your backtest and forward test results to understand how deep DD can get.
The main question is not “Did it make money?” but “How far can it sink?”
Use long backtests if possible
If you can, test over 10–20 years.
Short periods can make DD look small simply because the market happened to match the strategy.
Use a small fixed lot first (easier scaling later)
For fixed-lot testing, it’s useful to run a small lot first (e.g., 0.01 lot) and scale later.
- Example: Max DD at 0.01 lot is $200
- → at 0.1 lot (10×), DD is roughly $2,000
- → at 1.0 lot (100×), DD is roughly $20,000
So if your balance is only $1,000 but 0.1 lot implies about $2,000 DD, the account could be wiped out.
Also check forward tests (third-party verification helps)
Forward performance (e.g., via Myfxbook) reflects real-world friction.
Still, short forward periods are noisy, so prioritize longer histories when possible.
Step 2: Add a safety margin for live trading
Backtests are closer to ideal conditions.
Live trading includes friction like:
- Slippage
- Requotes / execution rejects
- Spread widening (news, rollover, thin liquidity)
- Latency (VPS / connection delays, especially for short-term systems)
So it’s realistic to assume live DD can be worse than backtested DD.
A simple conservative adjustment is to multiply expected DD by a buffer.
Rule of thumb: Expected DD = Backtest DD × 1.5 to 2.0
- Example: Backtest DD is $200
- → Expected DD might be $300–$400
Note: If the backtest DD looks unrealistically small (overfitting, delayed stops, etc.), this kind of math may not help.
In that case, question the strategy first.
Step 3: Decide tolerable DD (%) and reverse-calc the deposit
Next, decide your tolerable DD rate (e.g., 30% or 50%).
Then, reverse-calculate the deposit you’d need to keep DD within that range.
Simple formula
Required deposit ≈ Expected DD ÷ Tolerable DD rate
- Example: Expected DD is $400
- You want to cap DD at 50%
- → Required deposit ≈ $400 ÷ 0.5 = $800
Once you set this up, you can stay calm during a drawdown and judge whether it’s “within expectation.”
If DD approaches your limit, your actions become clear: reduce lot size, add stop rules, or diversify.
One non-negotiable rule
No matter how careful you are, markets offer no guarantees.
Only fund a trading account with money you can afford to lose without affecting your life.
Auto-Lot (Compounding): Control DD with a Risk Coefficient
So far, we’ve mainly discussed fixed/manual lot sizing.
But many EAs offer auto-lot (compounding), which adjusts lot size based on account balance.
Auto-lot can accelerate growth, but it can also amplify drawdown.
That’s why, with auto-lot, your “risk coefficient” (how aggressively lot size scales) often matters more than headline profit.
Auto-lot increases more than just profits
As balance grows, auto-lot increases position size.
That means swings grow too — and DD in both USD and % can expand.
- Return: tends to grow faster as balance rises
- Risk: equity dips (Equity DD) also tend to grow
The most important auto-lot metric: Equity Drawdown Relative (%)
For auto-lot, the top metric is Equity Drawdown Relative (%).
Money-based DD (USD) gets influenced by account size, so it’s less useful for comparing settings.
A practical reading is:
“With this risk coefficient, what is the worst % equity drawdown?”
Lower risk coefficient = lower profit, but also lower DD%
In the example below, the risk coefficient parameter is reduced from 3.0 → 1.5.
In general, lowering the coefficient reduces position size, so profit growth becomes smaller — but DD% (especially Equity DD) also drops.
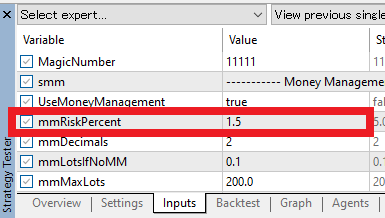
| Risk coefficient parameter | Profit: Total Net Profit (USD) | Drawdown: Equity Drawdown Relative (%) |
|---|---|---|
| 3.0 | 3,811,769.75 | 61.65% |
| 1.5 | 184,150.00 | 36.69% |
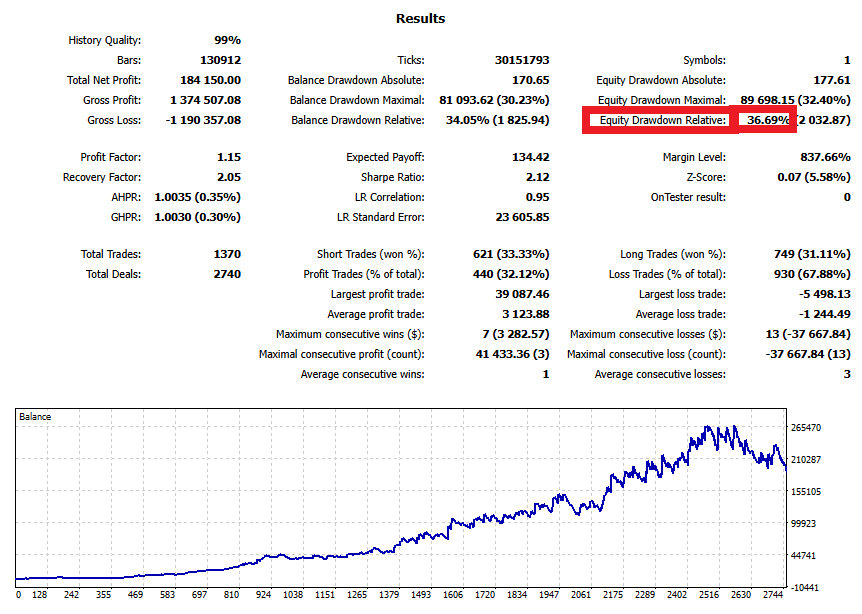
If your tolerance line is “DD up to about 36% is acceptable,” then this risk coefficient (1.5) becomes a candidate setting.
If your tolerance is 30%, you’d need to reduce the coefficient further or adjust conditions.
Recommended workflow: sweep the coefficient to find a setting within your DD limit
Don’t pick auto-lot settings by feel.
A safer approach is to test multiple values and find the one that stays within your tolerance.
- Decide your tolerable DD (tolerance line) first (e.g., max 40%).
- Run backtests with different coefficients (e.g., 3.0 / 2.0 / 1.5 / 1.0 …).
- Record Equity Drawdown Relative (%) for each test.
- Choose the best balance of return and DD that stays within your tolerance.
In short, auto-lot isn’t about maximizing profit.
It’s about finding a setting that keeps risk within a drawdown range you can actually live with.
Use Equity Drawdown Relative (%) as your core metric and adjust toward safety.
Related: EA Lot Size & Position Sizing: Fixed vs Auto Lot, Risk % Rules, and Starting Deposit Math
The price-scale trap: for XAUUSD, “DD in dollars” isn’t directly comparable
If you judge drawdown only by USD amount, long-term evaluation can go wrong.
This matters a lot for instruments like Gold (XAUUSD), where the price level has changed dramatically over time.
Example: Gold’s price level is 10×+ higher than it used to be
Gold’s average price in 2005 was about $444.84/oz, while spot prices around February 2026 were around $5,052/oz (varies by date).
That’s roughly a 10×+ change in price scale.
Same % move can mean 10× the dollar drawdown
This is the trap.
If gold drops by about 20%:
- 2005: $500 × 20% ≈ $100
- 2026: $5,000 × 20% ≈ $1,000
So “DD was $100 ten years ago” doesn’t mean “DD is about $100 now.”
Even with the same logic and lot size, a higher price level can make DD in USD look much larger.
How to avoid it: compare with % (especially for auto-lot)
- Auto-lot: evaluate mainly with Equity Drawdown Relative (%) (USD DD grows with account size)
- Fixed lot: also check USD DD, but compare with % and duration too
- For instruments like XAUUSD, don’t carry old “DD in dollars” intuition straight into today’s price level
Bottom line: when price levels change a lot, don’t judge safety by DD amount alone.
Use percentage drawdown to compare “how deep it can sink.”
Important: initial deposit can’t stay “old-school” either
When price scale changes (e.g., XAUUSD), the “minimum deposit” mindset can become dangerous.
At the price level 20 years ago, a balance of $200 might have been workable in some cases (depending on lot size and rules).
But today, volatility and P&L swings are often larger, so with only $200, a few stop-loss hits can put you at a very high risk of wiping out the account.
Spread widening and slippage can make it happen even faster.
- Then: lower price level → smaller dollar swings for the same % move
- Now: higher price level → larger impact → small deposits die quickly
Even if you see “low minimum deposit” marketing, judge it based on price scale and your own tolerance line.
Use backtest DD (% and USD) to reverse-calc a realistic deposit.
Practical Ways to Reduce Drawdown: Remove What You Can Control First
Even if an EA’s internal logic is a black box, you can often reduce DD through public parameters and basic operating rules.
The goal is not “zero drawdown,” but reducing tail risks — rare events that can cause fatal damage.
Below are common, practical steps that many traders can apply.
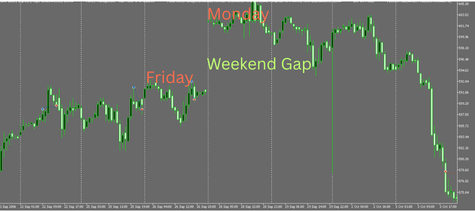
1) Weekend close: avoid Monday gap tail risk
FX and CFDs close over the weekend, but Monday’s open can gap.
A gap can trigger fills far worse than your stop-loss level, causing an unexpectedly large DD.
A practical solution is a weekend close: close all positions at a set time on Friday to avoid rare-but-fatal gap risk.
Practical tips
- Close before liquidity dries up (e.g., before the NY close on Friday).
- Avoid the spread blowout right after the weekly open; restart once conditions stabilize.
2) Cap the number of open positions: stop loss stacking
Holding many positions in the same direction means losses add up quickly when price moves against you.
Example: if you hold five long positions and the market drops, losses can escalate and recovery becomes harder.
Setting a cap on Max positions (or Max orders) can help.
EAs that add positions without limit (common in grid-style systems) are structurally high-risk and generally not recommended.
Checklist
- Can you set Max positions / Max orders?
- Does the EA keep adding in one direction without a hard stop? (high risk)
- Does the DD reduction justify the lower profit after adding the cap?
3) Avoid major news: reduce “one-hit drawdown” events
Major releases like Non-Farm Payrolls (NFP) can cause sudden spikes and spread widening.
Depending on the strategy, this can create a single large DD event.
Mean-reversion systems that hold positions for a long time or use wide stops often take the worst hits during these events.
In those cases, a news filter can help: close before the event, or block new entries around release time.
Note
- News avoidance depends on the strategy. Momentum systems may benefit from volatility.
- The goal isn’t “avoid everything,” but avoid time windows where spreads/slippage and sudden moves are most dangerous.
Summary: DD control is about removing “fatal risk triggers”
Reducing DD is often less about tiny tweaks and more about removing the conditions that cause one fatal hit.
Weekend gaps (weekend close), loss stacking (position caps), and sudden volatility (news filters) can improve DD quality when used correctly.
Conclusion: Judge DD by “survivable design,” not by “small numbers”
Drawdown (DD) isn’t just a scary number — it’s a practical measure of whether your account can survive.
The goal is not to chase EAs that “look safe,” but to build an operating plan where DD stays within a range you can tolerate.
At minimum, remember these
- DD type: prioritize Equity DD over Balance DD.
- Be suspicious of near-zero DD: in short periods, it may signal grid/martingale behavior, delayed stops, or overfitting.
Match the metric to your lot sizing
- Auto-lot (compounding): evaluate by Equity Drawdown Relative (%) (resilience by setting).
- Fixed lot: evaluate by Equity Drawdown Maximal (USD) (scale loss by lot size).
What to do next: tolerance line → settings → protection
- Decide your tolerance line (tolerable DD) first (e.g., max 30% or 50%).
- Confirm expected DD from backtests/forwards, then add a conservative buffer.
- If using auto-lot, test multiple risk coefficient values and pick one that stays within your tolerance.
- Use protections like weekend close, position caps, and news filters to reduce “one-hit” DD events.
In short, DD evaluation is not a contest to find the smallest number.
A strategy becomes a real long-term candidate when you can keep running it within a drawdown range you can actually handle.