Do trend-following EAs actually make money?

Trend following is often called a “classic” approach—but unfortunately, that doesn’t mean it will automatically win on its own.
In this article, we’ll cover the basics of trend-following EAs and then look at real test results using a sample EA (a simple trend-following pullback strategy). You’ll see, in plain terms, why it tends to stop working, and how you can design it to improve (filters, exits, and more).

What Is a Trend-Following EA?
A trend-following EA is an automated trading program that aims to profit by riding an existing market trend—for example, buying when price is moving up and selling when it’s moving down.
Related article: What Is an EA? How Forex Automated Trading Works, and How to Choose One | Complete EA Guide
Trend following is often introduced as a “go-to” strategy.
But here’s the key point:
if your trend detection and pullback rules are too simple, long-term performance can be unstable.
Markets spend plenty of time ranging (moving sideways) and can reverse suddenly, which creates more situations where you try to “follow the trend” but get trapped by false signals.
In this article, we’ll use a simple sample EA to test whether trend following really has an edge.
Then we’ll summarize practical improvements that are easier to apply in real trading (filters, exit design, and so on).
Conclusion Up Front: A “Simple Trend Entry” Alone Is Hard to Make Consistently Profitable
In this test, we built a sample EA using a typical “classic” setup:
“Trend detection with CCI × pullback detection with a moving average + fixed SL/TP/trailing stop”
—basically a simple “buy the dip / sell the rally” trend strategy—and ran it on long-term data.
The result:
on most symbols other than EURUSD, we couldn’t confirm a clear edge.
Also, once we optimized parameters, we found that
results varied a lot (meaning small parameter changes caused big performance swings).
In other words, even though trend following is often seen as a “strong strategy,” simple rules alone may not stay stable over the long run.
At the very least, this test suggests that it’s difficult to keep winning long-term with only a single, simple logic and basic conditions.
Testing the Edge of Trend-Following EAs With a Self-Built Sample EA | Backtest & Optimization Results
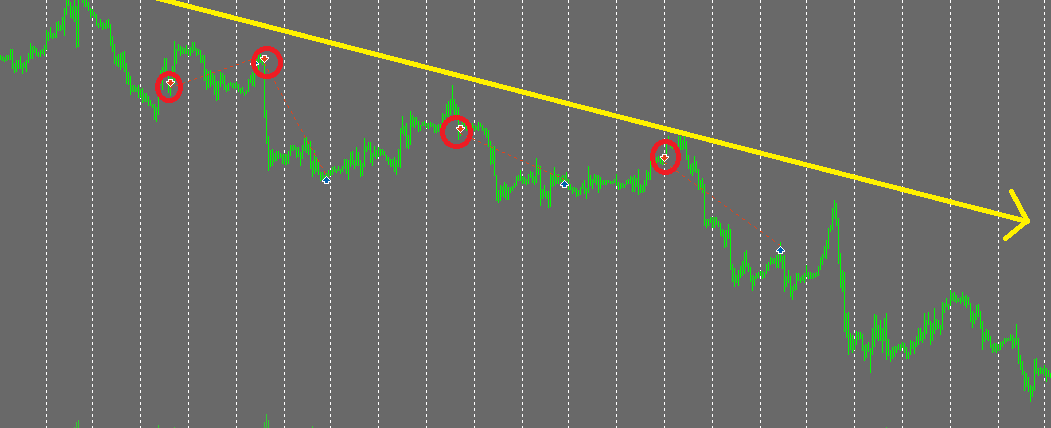
From here, we’ll test whether trend following has an edge using a sample EA designed to enter on pullbacks during a trend—“enter on a dip within a trend.”
EA Design Overview (Intentionally Simple)
- Trend detection: Use CCI crossing above/below the 0 line to decide direction
- Pullback detection: Use the relationship between a moving average (MA) and price to identify pullbacks / retracements
- Exit: Percentage-based SL/TP/trailing stop
We kept the rules limited to “CCI × MA × price position”, prioritizing repeatability (same inputs → same behavior) and clarity.
Optimization Approach and Parameters
- Parameters optimized: CCI period, MA period, SL, TP, trailing stop (wide ranges)
- Test settings: Initial balance 1,000 USD / fixed lot 0.01 / period 2005-01-01 to 2025-08-30
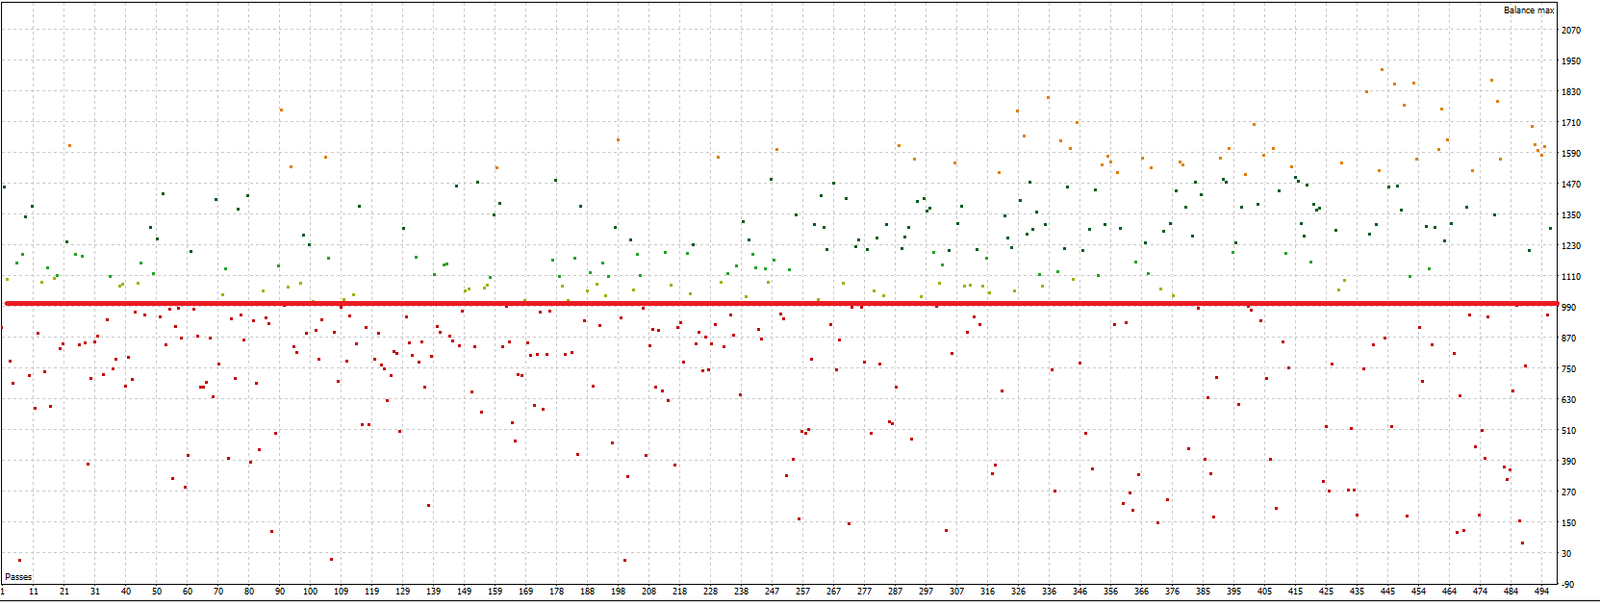
Looking at the scatter plot, good and bad solutions are mixed, and profit swings widely with small parameter changes.
This suggests either the core logic doesn’t have a strong edge or it depends heavily on market/symbol characteristics.
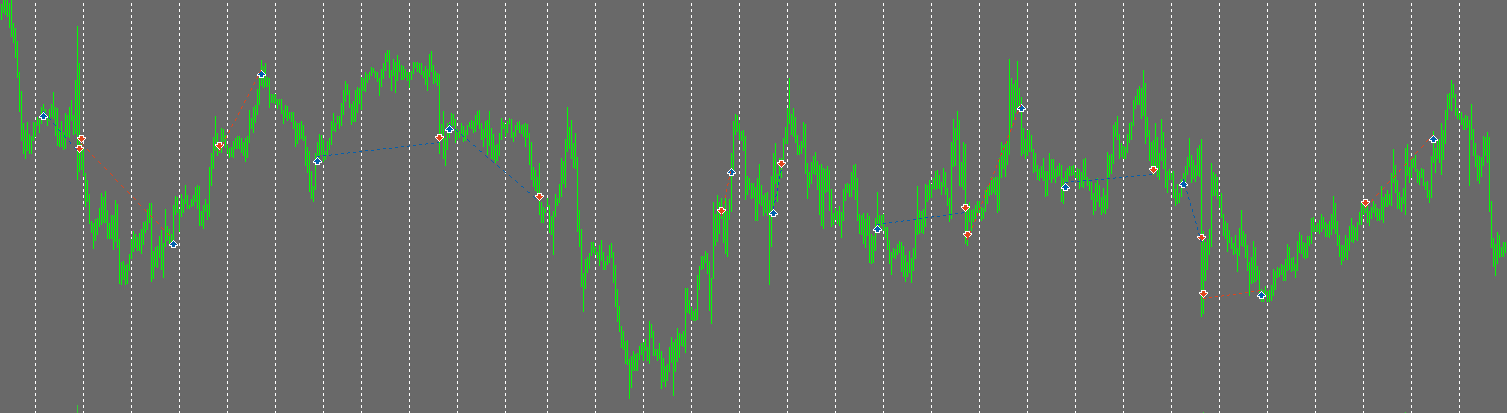
As shown in the first chart, the EA does target “pullbacks during a trend.”
Even so, if the results aren’t stable, it’s risky to assume “it should work because it’s a classic strategy.”
Also, the bigger the spread, the easier it is to fall into over-optimization (curve fitting).
Even if you find parameters that look great, they may not hold up in live trading.
EURUSD Backtest (2005–2025)
After optimization, the best-looking backtest result was the following:
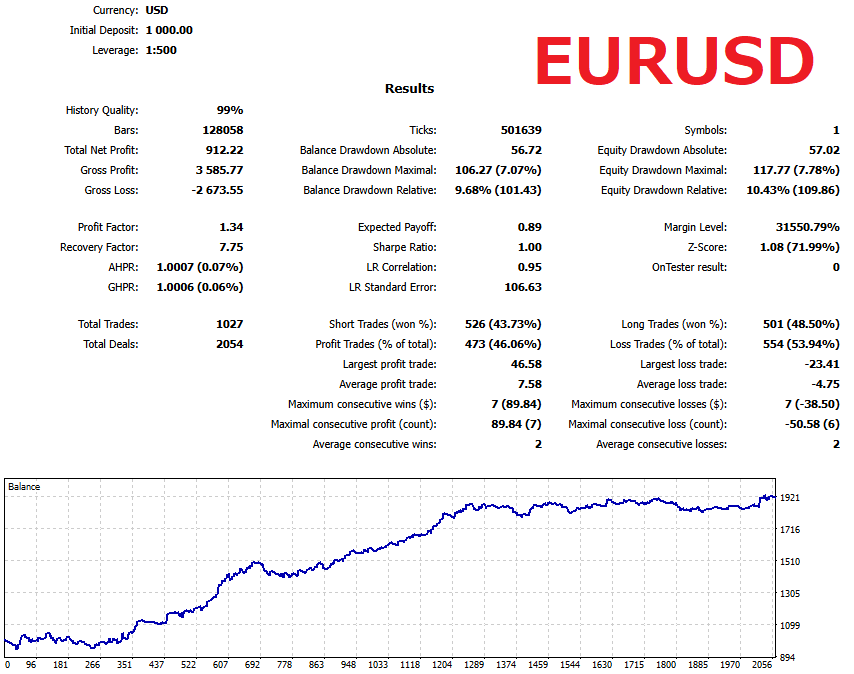
- Net profit: +912.22 USD (balance 1,912.22)
- Trades: 1,027 (win rate ~46.1%)
- Profit Factor: 1.34
- Expected Payoff: 0.89
- Sharpe Ratio: 1.00 / Recovery Factor: 7.75
- Max drawdown: balance-based 9.68%, equity-based 10.43%
- Average win: +7.58 / Average loss: -4.75 → RR ≈ 1.60
The equity curve is upward overall.
But since this is optimized, you can usually “make it look good” to some extent.
On the other hand, performance can weaken when market conditions change.
In this test, the later period looked more flat, which may reflect a shift in market regime.
Out-of-Sample Cross-Symbol Test on Majors & GOLD (XAUUSD)
Next, we applied the EURUSD-optimized parameters as-is to other major pairs and gold (XAUUSD), then compared the results.
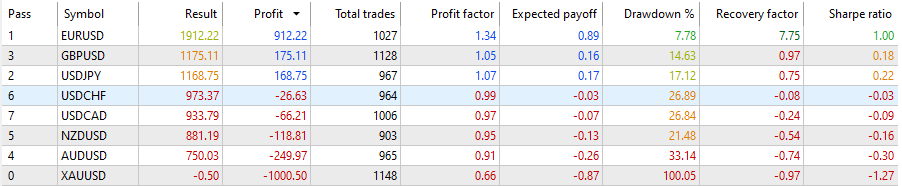
| Symbol | Profit | Total trades | PF | Expected | DD% | Recovery | Sharpe |
|---|---|---|---|---|---|---|---|
| EURUSD | +912.22 | 1027 | 1.34 | 0.89 | 7.78 | 7.75 | 1.00 |
| GBPUSD | +175.11 | 1128 | 1.05 | 0.16 | 14.63 | 0.97 | 0.18 |
| USDJPY | +168.75 | 967 | 1.07 | 0.17 | 17.12 | 0.75 | 0.22 |
| USDCHF | -26.63 | 964 | 0.99 | -0.03 | 26.89 | -0.08 | -0.03 |
| USDCAD | -66.21 | 1006 | 0.97 | -0.07 | 26.84 | -0.24 | -0.09 |
| NZDUSD | -118.81 | 903 | 0.95 | -0.13 | 21.48 | -0.54 | -0.16 |
| AUDUSD | -249.97 | 965 | 0.91 | -0.26 | 33.14 | -0.74 | -0.30 |
| XAUUSD | -1000.50 | 1148 | 0.66 | -0.87 | 100.05 | -0.97 | -1.27 |
Observation: On EURUSD, it looks reasonably solid at first glance (PF 1.34, DD ~8%). But the edge is thin on other symbols.
In particular, XAUUSD collapses (PF 0.66, DD ~100%), which suggests you can’t simply copy-paste the same rules across markets and expect it to work.
Takeaways: Effectiveness and Risks (Overfitting / Lack of Portability)
- Effectiveness: On EURUSD, optimization produced an upward equity curve. The average RR of ~1.6 isn’t bad.
- Risk: Because the optimization results were highly scattered, performance changes a lot with small parameter tweaks. That means weak repeatability and a strong overfitting risk.
- Portability: Results dropped easily when moving across currencies/commodities. A simple CCI + MA rule may struggle to handle each market’s personality (volatility, reversal strength, session behavior, etc.).
Improvement Ideas and Potential
These ideas can help, although if the base logic doesn’t have much edge, improvements may be limited.
- Add a regime filter (market state filter): Use rising ADX, rising ATR, widening Bollinger Band width, etc. as entry conditions to reduce range-market false signals.
- Move from fixed SL/TP to adaptive: Instead of fixed distances, size stops/targets using ATR multiples so they fit current volatility and avoid being too tight or too wide.
- Improve entry quality: Don’t chase right after a breakout. Focus on only pullbacks + re-acceleration. If needed, use multi-timeframe confirmation (higher-timeframe alignment) to cut low-quality entries.
What This Test Suggests
“Trend following + pullbacks” is often treated as a classic approach, but in a simple form like this, it often fails to deliver a stable edge.
More complexity may improve results, but the more complex you make it, the more you risk lower portability and stronger overfitting.
Also, even within trend strategies, a breakout EA can sometimes show better portability even with a simple setup.
See: Can Breakout EAs Win? Testing a Self-Built EA – Pros, Cons, and Practical Tips
Pros of Trend-Following EAs
They can capture big moves and build strong risk-reward
The main strength of trend-following EAs is that even with a modest win rate, they can be designed to “make a lot when they win”.
That makes it easier to achieve average win > average loss, and therefore a positive expectancy over time.
You can picture expectancy (average profit/loss per trade) like this:
E = win rate × average win − loss rate × average loss
Example: win rate 42%, average win +180 pips, average loss −90 pips
E = 0.42×180 − 0.58×90 = +23.4 (pips/trade)
For trend systems, a few big trends per year can sometimes drive most of the results.
That’s why exit designs that “let winners run”—like trailing stops + partial take-profit—fit trend following well.
Compared with grid or martingale strategies (which can blow up an account) and scalping (which often struggles with repeatability and costs), trend following is structurally a more “healthy” approach.
The logic is simple and easy to understand
Trend following matches a simple intuition: buy when price is going up, sell when it’s going down.
As an EA, it’s also easy to structure rules like trigger → order → follow → exit.
That makes it easier to explain “why it entered here” and “why it exited there.”
Example: 20-period high breakout + ATR 1.5 initial SL + trailing based on the latest swing
You can describe the logic clearly alongside actual price action.
It matches a real market force: momentum
Trends can extend due to real flows—scaled institutional execution, CTA trend-following money, position adjustments after news, and more.
In other words, real money flows can create momentum.
From that perspective, trend following is a rational behavior: trade with the flow.
But whether it works well depends heavily on the instrument, trading session, and market regime.
Cons of Trend-Following EAs
Weak in ranges, where small losses can pile up
Trend following struggles most when the market is moving sideways (range-bound).
With no clear direction, you get repeated “looks like it might break” moves, which leads to constant false signals.
The result is often a series of small stop-outs that slowly drain the account.
(Trend following is basically “keep trying until the trend arrives,” so this is the hardest part.)
Losing streaks feel brutal (the “wait until it comes” structure)
Trend following often becomes a pattern of “many small losses, then occasional big wins.”
That means losing streaks are common, and many traders give up before the system pays back.
An EA has no emotions, but the person running it often worries:
“Is this drawdown normal, or is the strategy broken?”
Entries tend to be late (easy to end up chasing)
Signals like MA crossovers or breakout of highs/lows naturally appear after price has already moved.
Depending on timing, you might enter after most of the move is done, get a quick pullback, and stop out.
This is especially common in volatile markets where breakouts can end as a “wick only” move.
Highly dependent on market conditions; weak years don’t grow much
Trend following shines when trends exist.
But in years with few trends or long range periods, performance tends to stall.
So it’s hard to avoid flat periods and drawdowns entirely.
If you expect a perfectly smooth equity curve, the reality will feel disappointing.
Market Conditions Where Trend-Following EAs Tend to Work Better
Trend-following EAs are highly sensitive to market regime.
They work best in markets that, simply put, “keep moving in the direction they start moving.”
Adding a few targeted conditions can improve results—but if you add too many, you increase the risk of overfitting (curve fitting).
The rule of thumb is: don’t add more; add only what truly helps, and keep it minimal.
① When volatility starts expanding (early volatility expansion phase)
Trend strategies assume that once the market starts moving, it will continue in that direction for a while.
So the best time is often right after volatility begins to expand.
- How to spot it: Bollinger Band width expands, ATR rises, multiple large-body candles appear, price spends more time outside the bands, etc.
- The “afterglow” after news: After a major release or headline pushes price hard in one direction, price often pulls back and then extends again (you’re aiming for the “restart,” not the first spike).
- Entry idea: Instead of jumping in immediately on the breakout, waiting for a small pullback → re-acceleration often reduces false entries.
- Exit idea: Because swings are larger, adaptive SL/TP/trailing based on ATR multiples can reduce getting stopped out too quickly.
- Common mistake: Keep chasing after volatility expansion ends and the market returns to a range. If BB width or ATR stops growing, consider lowering trade frequency or pausing.
② High-participation sessions (London to New York tends to extend more)
When more traders are active, breakouts are more likely to follow through.
The London–New York overlap is especially active and often more trend-friendly.
- Session filter: Many pairs range during the Asian session, which can hurt trend following. Restricting trades to London open through early NY can improve stability.
- Handling major releases: Right before key data, price can whipsaw and hunt stops. It’s often safer to participate after direction appears post-release.
- Implementation hints: Add “allowed trading hours,” “news lockout (no new entries X minutes before/after),” and “skip when spreads widen.”
③ Markets where orders naturally pile into the same direction (conditions that support trend continuation)
Trends don’t extend randomly—there’s usually a reason.
Institutional flows, added hedges, and follow-through buying/selling can combine to create a state where
“when price rises, more buying appears / when price falls, more selling appears.”
In those conditions, trend strategies tend to work better.
- Examples that can fit: Stock indices (like US100), some commodities like crude oil, and major FX pairs (EURUSD/GBPUSD/USDJPY) during periods with clear trends.
- Examples needing caution: Markets like gold (XAUUSD), where headlines and rate expectations can trigger sudden reversals, often struggle with a simple pullback trend system.
- Design approach: Use stats to understand each instrument’s typical pullback depth and average trend length, then adjust pullback tolerance and trailing speed—without pushing it too far.
④ Timeframes with less noise (H1/H4/D1 are the basics)
The biggest enemy of trend following is meaningless noise.
Lower timeframes have more noise and higher cost impact (spread relative to movement), making it easier to get caught in:
false breakout → stop-out → immediate break again.
- Recommended timeframes: H1/H4/D1. Signals are more stable and cost burden is relatively lower.
- Higher-timeframe filter: Use higher-timeframe MA slope or new-high/new-low checks to decide if conditions are trend-friendly, then allow/deny lower-timeframe entries.
- Enough samples: Too few trades makes results unstable. Testing across multiple symbols × H1/H4 via diversification helps increase sample size.
⑤ Decide what NOT to trade (avoid low-volatility ranges)
When trends don’t exist, trend systems often rack up many small losses.
So it helps to give the EA clear rules for “don’t fight here.”
- Pause new entries: If BB width or ATR falls below a threshold, stop new entries. When ADX is low, allow management only (no new trades).
- Avoid late-stage moves: If the breakout candle is too large, don’t chase it. Limiting entries to pullback → restart only reduces buying tops/selling bottoms.
- Order ideas: Use market entry + conservative trailing, or a two-step approach like limit order to wait for pullback → then follow with market entry on re-acceleration.
- Operational idea: Mix FX, indices, and commodities to diversify correlation so “something runs somewhere,” smoothing the impact of flat years.
Common Misunderstandings and Pitfalls
- “Trend following = guaranteed wins / works everywhere” is a myth. In range markets, losses often increase.
- Don’t feel safe just because optimization shows a “clean upward curve.” If it’s overfit, backtests look great but live trading can break quickly.
- “Just widen the stop-loss and it will win” is dangerous. It may boost win rate short-term, but it increases losses when you’re wrong and often hurts long-term performance.
- Don’t judge by short periods (e.g., one month). Trend systems often “lose small most of the time, then recover in a few trend runs.” Instead of cutting it based on monthly P/L, evaluate over at least one year—ideally multiple years.
Summary
Bottom line: Trend-following pullback EAs are often called a classic approach, but this test suggests that with simple rules alone, it’s hard to stay consistently profitable across the long term, across symbols, and through market regime changes.
That said, a clear strength is the ability to ride trends and build average win > average loss (risk-reward).
To benefit from that strength, you need a design that avoids bleeding in range markets.
Possible improvements include filters that target “when markets are more likely to move” using ATR or ADX, session filters, and exit design (trailing, adaptive SL/TP).
But adding too many conditions increases the risk of overfitting (curve fitting), so keep additions to the minimum necessary.
For real trading, don’t blindly trust the “best-looking” backtest settings.
Validate with cross-symbol tests, tests on different periods, and forward testing.
Understanding “when it’s strong and when it’s weak” is the fastest way to avoid failure with trend-following EAs.
FAQ
- Q: So, are trend-following EAs actually profitable?
- A: They can perform well when trends are clear, but when markets stay range-bound (sideways), losses can pile up. So they’re not “universal.” To improve results, it’s important to use market-condition filters and solid exit design (like trailing), and focus only on the situations where they’re more likely to work.
- Q: I’m worried because the win rate is low. Is a low win rate normal for trend following?
- A: Yes, it’s common. Trend systems often “lose small and win big,” so what matters is not the win rate but average win > average loss (risk-reward) and expectancy. If you focus only on win rate, you may make the wrong adjustments (like widening stops), which can hurt long-term performance.
- Q: After optimization, the equity curve looks great. Is it safe to go live?
- A: Be careful. Even if optimization looks good, high parameter sensitivity often means overfitting (curve fitting). Check whether it holds up with slightly different tests (different periods, symbols, timeframes), and confirm it also works in forward testing before deciding.
- Q: Which timeframe is best? Can it work on short timeframes like M5?
- A: For beginners, H1/H4/D1 is a better starting point. Short timeframes have more noise and a heavier cost ratio (like spread), which makes false signals more frequent. If you trade short timeframes, you’ll likely need stronger “don’t trade” rules, such as session filters and volatility filters.
- Q: Which is better—trend following or breakout?
- A: Both have pros and cons, but in simple tests, breakout strategies sometimes show better portability. Pullback trend systems often require more waiting and can be more regime-dependent. What matters most isn’t preference—it’s proving which conditions create an edge through testing.