I’ve tried all kinds of indicators, but I still can’t seem to win…
I’m entering exactly when the signals tell me to, too…

Before anything else, have you tested—using actual numbers—whether the signals from that indicator really have an edge?
In many cases, it’s structurally difficult to keep winning with an indicator by itself. To make a strategy consistently profitable, you need solid rule-setting, proper testing, and high-quality execution.
In this article, I’ll first break down why it’s hard to win using indicators alone, then explain— in a beginner-friendly way—how to turn indicators into something you can truly use as a weapon by automating them with an EA (expert advisor / automated trading).

Why You Can’t Win With Indicators Alone: The Common “Losing Structure”
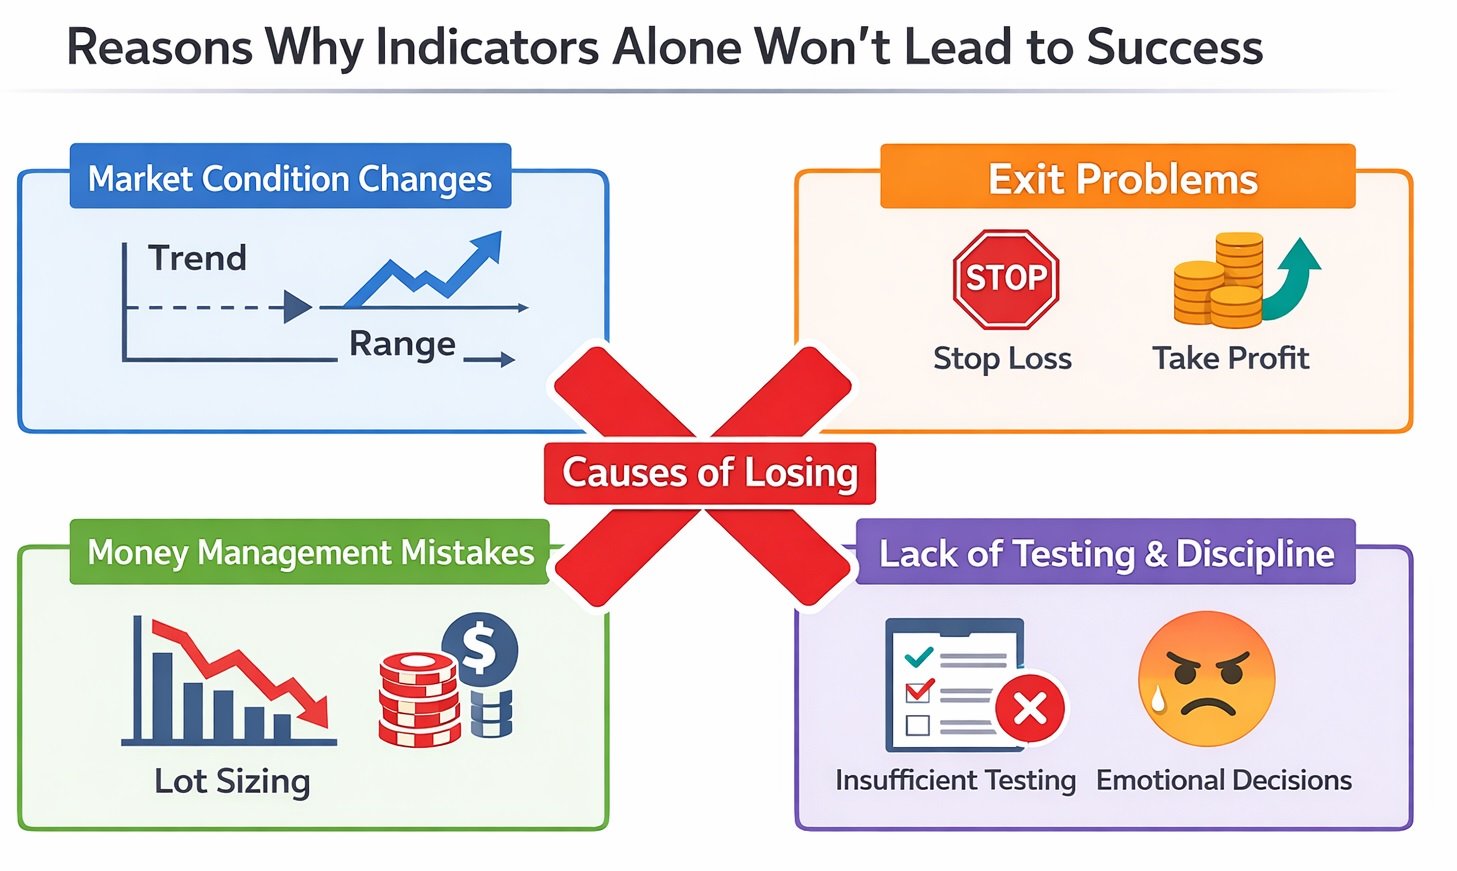
1) In many cases, the biggest issue is simple: the “edge” was never validated
The biggest reason discretionary indicator-based trading tends to lose is surprisingly simple:
Many traders run a set of rules without ever confirming whether it truly has an edge (a real statistical advantage).
At its core, FX trading is basically this: repeat a probabilistically favorable rule under the same conditions, many times.
Even with a coin toss, if you had a coin that lands heads 60% of the time, the longer you keep betting the same way, the more likely you are to end up profitable.
Trading is the same. The foundation is to find a structure that tends to be profitable (or tends to have positive expectancy) and repeat it.
But with discretionary indicator trading, people often end up in this situation:
- Rules are vague (“buying because it feels right,” “taking profit based on vibes”)
- No proper testing (they only remember the times it worked in the past)
- Decisions change depending on the market or mood (reproducibility collapses)
In that state, you can’t even tell whether you’re taking probabilistically favorable actions—so your odds of winning drop.
That’s why, before adding more indicators, you should first check:
“Is this rule likely to be profitable over the long run?”
At minimum, define clearly:
entry conditions, stop loss, take profit, and no-trade conditions (filters).
Then verify, using historical data, whether repeating the same rule tends to produce positive results. Doing this alone reduces mistakes dramatically.
Related:
» Trading Edge Explained: How to Build a Statistical Advantage in 4 Steps
» Probability-Based Forex Trading: Expectancy, Risk–Reward & EA Backtesting
2) The real drivers of results—exits and risk—are often outside the indicator
“Where to enter” gets the spotlight, but what usually determines performance is:
where to exit (take profit / stop loss) and how big to bet (position sizing / money management).
Even if you enter from the same place using the same indicator, changing only exits and risk can completely change the outcome.
Because P&L is not decided only by entry timing—it’s decided by:
the average size of wins, the average size of losses, and whether you can survive losing streaks.
Even with good entries, weak exits make you lose
A classic beginner pattern looks like this:
- Stop loss is delayed or missing: small wins accumulate, then one large loss wipes everything out
- Take profit is too early: win rate looks high, but profits are too small to grow
- Stop loss keeps being extended: you “endure” drawdown until it becomes an unexpected disaster
Indicators can be helpful as “buy/sell hints,” but how far price can run or how deeply it can pull back varies heavily by context.
So it’s often hard to design clean, reliable exits using indicators alone.
Sometimes “simple exit rules” outperform indicator-based exits
In real trading, performance is sometimes more stable with simple exit rules like:
- Fixed pips take profit / stop loss (easy to test and validate)
- Trailing stop (as profit expands, the stop follows)
- Time-based exit (if it doesn’t move within a set time, close it)
The goal is not to “guess the perfect exit,” but to build an exit structure that tends to produce positive results over time.
Weak risk management can force you out—even with an edge
Money management is even more important.
Even good strategies have losing streaks. If your lot size is too large, the account can’t survive the drawdown and you’re forced to quit.
The basics of risk management start with:
decide in advance how much (or what percentage) you’re willing to lose per trade.
For example: “Max 1% of balance per trade,” then adjust lot size as equity changes (reduce size when balance drops, increase when it grows).
This makes it far less likely that a losing streak becomes fatal—and it allows you to keep running a strategy that has an edge.
In other words, even if an indicator helps with entries,
the core of consistently winning is exit design (TP/SL) + money management (risk design).
The more these are disciplined, the more stable your results become.
3) Discretionary trading makes “execution quality” unstable (you don’t follow the rules)
Even with the same indicators, discretionary trading creates “execution drift” such as:
- Missing signals / entering late
- After losses, getting scared and skipping trades (missed opportunities)
- After wins, over-sizing (blow-up risk)
- Moving stops / taking profit too early (destroying expectancy)
So it’s often not “the indicator is bad,” but inconsistent execution breaks expectancy.
Related articles:
Emotions in Forex Trading: 7 Triggers That Break Your Rules (And How to Fix It)
Discretionary vs. Automated Forex Trading (EAs): Pros, Cons, and Red Flags
4) When market regimes change, the same indicator can turn against you
A major reason it’s hard to win with indicators alone is that market regimes constantly change (trending vs ranging).
- Indicators strong in trends tend to fail in ranges
- Indicators strong in ranges tend to fail in trends
So if you keep using the same indicator the same way, the moment the regime changes, it can quickly become counterproductive.
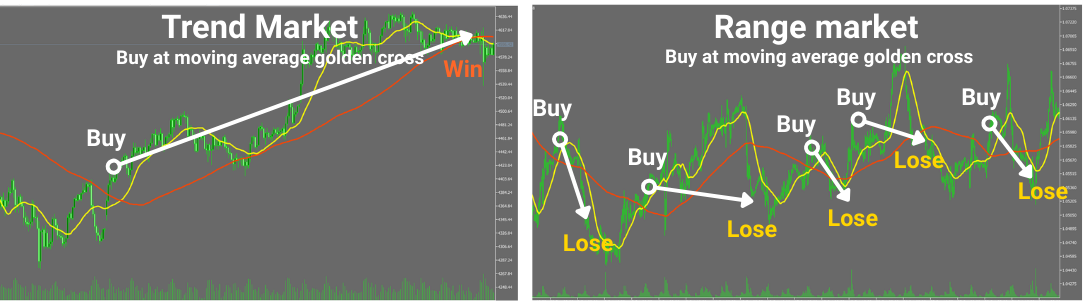
■ Example 1: Trend indicators (moving averages, etc.)
Trend-following using moving averages (e.g., entering on a golden cross) often works when a strong uptrend or downtrend exists.
But in a range market where price oscillates back and forth, crosses happen frequently and become
false signals (repeated stop-outs), causing performance to collapse.
■ Example 2: Oscillators (RSI, MACD, etc.)
On the other hand, mean-reversion using oscillators like RSI or MACD can work well in ranges, capturing bounces from “overextended” conditions.
But in strong trends, “overbought/oversold” can persist for a long time, and counter-trend entries can get squeezed repeatedly—leading to large losses.
This is not a “flaw” of indicators—it’s a natural consequence of the fact that markets are non-stationary (their characteristics change over time).
Market behavior changes not only by trend vs range, but also by:
- Volatility (how large price swings are)
- Trading session (Tokyo / London / New York, etc.)
- News windows (major data releases, speeches, etc.)
The problem is: when you trade an indicator on its own, it often can’t reliably judge these changing conditions.
As a result, it generates the same decisions not only in favorable situations but also in unfavorable ones—
and your overall performance becomes unstable.
Conclusion:
There is no indicator that can keep generating winning signals in every market environment.
And there is also no indicator that can always correctly determine whether the current market is trending or ranging.
That’s why you should not treat indicators as “universal answers.”
Instead, the key is to think in terms of:
change how you use them depending on the environment (or avoid trading).
Indicators Aren’t “Useless.” The Problem Is How They’re Used
After reading this far, you might think, “So indicators are meaningless?”—but that’s not true.
When used well, indicators are tools that quantify market conditions and make them visible.
They let you observe objective information (momentum, overheating, volatility) that’s easy to miss by watching candles alone.
But what matters is: don’t treat an indicator as “the correct answer for signal trading.”
Many people default to “a signal appeared, so I buy/sell.”
That alone can’t adapt to regime changes, and performance often collapses.
Indicators deliver the most value when used as support tools like:
- Conditional branching: switch strategies based on market state
- Filtering: avoid trading in low-probability situations
- Risk adjustment: reduce size or stop when conditions are dangerous
And the best way to execute this “correct usage” consistently is with an EA (automation).
With an EA, you can reproduce the same conditions every time, and testing via backtests/forward tests becomes much easier.
In my own work, I’ve repeatedly tested strategies by combining multiple indicators and automating them.
What I’ve strongly learned is this:
Indicators tend to work better for environment recognition and filtering than for entries.
Example: ATR is better as a volatility filter than as an entry signal
ATR (Average True Range) measures volatility (the size of price movement).
It’s difficult to decide “buy/sell” using ATR alone, but it’s extremely useful for judging whether the market is tradable.
In high-volatility markets, ranges are larger and breakout-style strategies often perform better.
In low-volatility markets, price tends to chop back and forth, making mean-reversion relatively more favorable.
Using this idea, ATR can be used as an “entry filter” like:
- ATR above a threshold → run only breakout strategies (avoid mean-reversion)
- ATR below a threshold → consider only mean-reversion (avoid breakouts)
- ATR spikes sharply → reduce lot size / avoid trading (treat as unstable conditions)
By judging the market condition first and fighting only in favorable situations,
an indicator becomes not a “signal,” but a tool for improving win rate and expectancy.
So the key is not “use indicators as the correct signal,” but use them for:
market regime detection, trade filtering, and risk adjustment.
And to execute those rules consistently—and improve them through testing—EAs (automation) are an excellent match.
In the next section, I’ll explain why automation turns indicators into “weapons,”
and how it raises both execution quality and testing efficiency compared to discretionary trading.
Why Indicators Become a “Weapon” When Automated with an EA
Indicators are often used as “buy/sell signals,” but originally they are tools that quantify market conditions.
When you implement them in an EA, you can take indicator values and turn decisions into:
rules → testing → improvement,
making indicators far more useful as real building blocks of performance.
Related articles: What Is a Forex EA (MT4/MT5)? An Automated Trading Guide
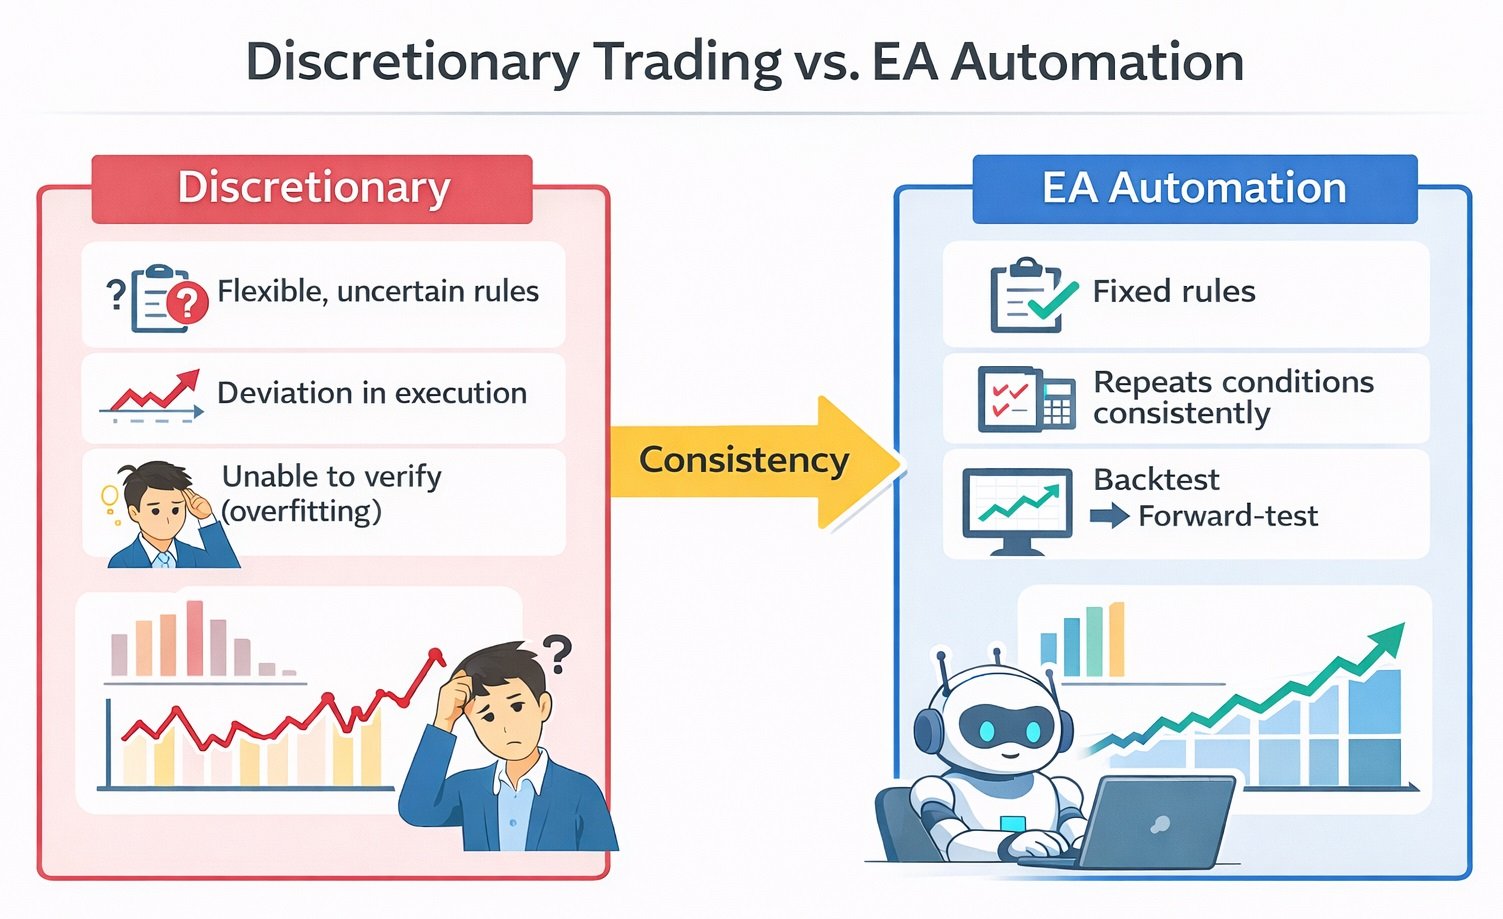
1) Rules become fixed, and execution stops drifting
One major reason discretionary performance is unstable is execution drift.
Even looking at the same indicator, humans change decisions based on emotion and context:
- Missing signals / entering late
- After losses, getting scared and skipping trades
- After wins, getting aggressive and entering outside the rules
- Moving stops / taking profit too early
An EA has no emotions.
If conditions match, it executes. If they don’t, it won’t.
That alone greatly fixes discretionary weakness: lack of reproducibility.
2) Testing (backtest / forward) becomes fast and scalable
The biggest advantage of automation is:
you can confirm with numbers whether a rule truly has an edge.
With MT5 Strategy Tester, you can run the same rule across long periods and a large number of trades to see the outcome.
That means you can evaluate indicators not by “feel,” but by probability and statistics (expectancy).
With discretionary trading, it’s hard to keep taking “probabilistically favorable actions” because:
- Rules are vague, so entries differ slightly each time
- Only winning examples are remembered; losing cases aren’t properly reviewed
- Stops and profits become ad-hoc decisions
When you define conditions clearly in an EA, backtests reveal where you win and where you lose.
That enables analyses like:
- Performance is bad only in certain sessions (→ time filter may help)
- Losses increase when volatility is high (→ maybe avoid via ATR)
- Specific scenarios cause losing streaks (→ need stop conditions or lot controls)
You can make decisions based on numbers, not “it feels good.”
And beyond backtesting, you can forward test in demo or micro-lots to track real conditions (spread, slippage, etc.).
3) You can layer multiple “environment filters”
The weakness of a single indicator is that it can turn counterproductive when the environment changes.
But with an EA, you can use indicators not for “entry signals,” but for environment recognition (filters).
For example, “enter on MA cross” alone can be fragile.
But with an EA, you can break the logic into layers:
- Trend filter: trade only when higher-timeframe MAs have slope
- Volatility filter: avoid excessively unstable markets using ATR or range width
- Session filter: exclude certain sessions / spread-expansion windows
- News filter: stop around major economic events
By stacking environment recognition, you can counter the key weakness: regime change.
In other words, you can build systems that choose favorable conditions and avoid unfavorable ones.
4) Risk management becomes “a mechanism” (avoid ruin)
For survival in FX, what matters most is not “when you win,” but how you lose.
Every strategy has losing streaks. The key question is whether your design can survive them.
With an EA, risk management can be fixed as a system:
- Cap max loss per trade (e.g., up to 1% of balance)
- Limit max positions / simultaneous holdings (prevents infinite averaging)
- Stop at max drawdown (circuit breaker)
- Automatic lot calculation (adjust size based on balance and SL distance; rule-based compounding)
When automation gives you: “testable,” “consistent execution,” and “controlled losing,”
indicators become more than simple signals—they become materials that create an edge: a weapon.
To summarize: EA automation gives you reproducibility and testing efficiency,
so indicators work best as tools for market regime detection, filtering, and risk adjustment—not as simplistic signals.
In the next chapter, I’ll introduce practical examples using indicators like ATR, moving averages, and RSI:
how to design filters that decide “trade / don’t trade,” and how to switch strategies clearly and safely.
Indicator × EA: Practical Design Patterns for Real Trading
The key to using indicators in an EA is not blindly trading every signal.
The goal is:
focus only on favorable conditions and control how you lose.
So instead of treating indicators as “trade alerts,” use them as inputs for judging market conditions.
Here are three practical patterns that even beginners can adopt.
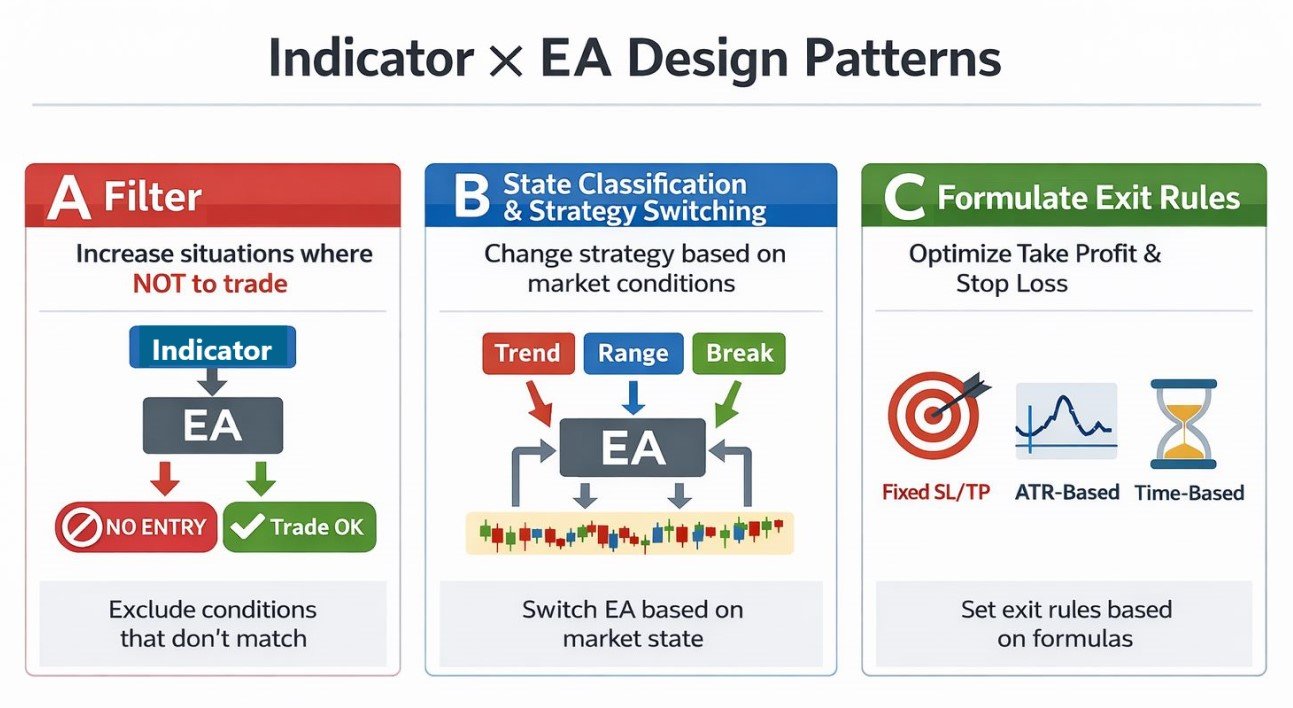
Pattern A: Use indicators as filters, not as entry triggers
A strong starting approach is to use indicators not to trigger entries, but to
increase “no-trade situations” (avoid low-probability conditions).
Many beginners default to “enter when a signal appears,” but what often matters more is
the decision not to enter.
With an EA, you can execute avoidance rules consistently.
- Example: If RSI is too high/low, don’t trade
Overheated conditions can reverse suddenly or fail to extend.
This helps reduce “late trend” entry accidents. - Example: If ATR is too low, don’t trade
In low-volatility markets, breakout strategies get more false breaks.
Just avoiding “forcing trades in dead markets” can stabilize results. - Example: Stop trading when spreads are wide
During low-liquidity hours (early morning, etc.), costs can dominate.
Avoiding those windows alone can improve performance.
The aim is simple:
reduce losses before trying to “win more.”
Pattern B: Classify “market state” and switch strategies
No single strategy works in every market condition.
Because trends and ranges favor different kinds of price action.
With an EA, you can classify regime using indicators and switch rules by state:
- Trend mode ON (e.g., higher-timeframe MA is sloping)
→ focus on pullback entries / trend-following - Range mode ON (e.g., price stays within a band)
→ mean-reversion with small size and faster profit-taking (assume it won’t run far) - High-volatility mode ON (e.g., ATR spikes)
→ reduce lot size or stop (avoid chaos accidents)
The key is to use indicators not as “signals,” but as market mode detectors.
However, note an important limitation:
Even if you can detect the regime “right now,” you can’t know how long it will last.
A trend can quickly turn into a range, and vice versa.
If anyone could predict the next regime perfectly, trading would be easy.
In my development experience, regime detection is not a magic switch that dramatically changes results by itself.
That’s why it should be used together with risk management and stop conditions, not relied on alone.
Pattern C: Stabilize exits (SL/TP/breakeven) by turning them into formulas
More than indicators, exit design (take profit / stop loss / breakeven) often has the most direct impact on results.
Even with the same entry, changing exits can massively change:
win rate, average profit, and max loss.
When you automate, exits can be fixed as formulas (rules), not emotional decisions.
That makes performance more stable over the long run.
- Fixed SL/TP (simple)
Beginners should often start with fixed distances, because it makes validation safer and easier. - ATR-based SL/TP
Wider when volatility is large, tighter when small—easy to adapt to conditions. - Time-based exit
If it doesn’t move within a set time, close it—helps avoid “slow bleed” trades.
The aim is to avoid over-relying on entry precision and instead build mechanisms for:
“how you lose” and “how you lock in gains.”
Common Beginner Mistakes & Warnings (How You Still Lose With Indicator × EA)
EAs can be powerful—but they are not magic.
No EA wins in all market conditions, and when regimes change, performance can break down (this is normal).
Beginners in particular face a high risk of being deceived by malicious EAs.
I’ve personally been fooled by “looks profitable” EAs in the past.
Because with the right presentation, EAs can be made to look profitable in many ways.
Some are sold at high prices, and eventually the account balance can fall to near zero.
Below are common traps that cause people to lose even with indicator × EA systems.
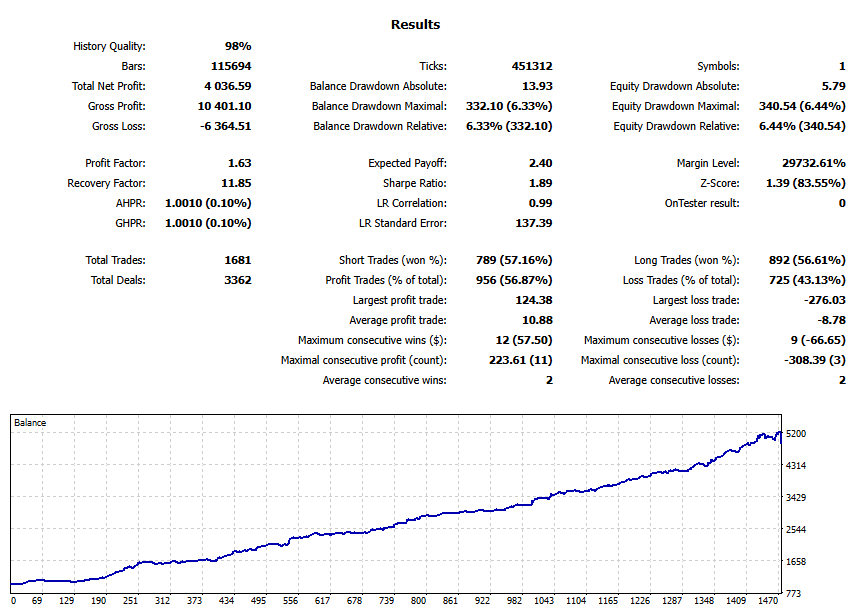
NG1: Jumping into “too perfect” backtest curves
A backtest curve that is unrealistically smooth and always rising looks attractive—but you should suspect it first.
Because over-optimization (fitting too tightly to historical data) is very common.
It’s easy to create something that only works in the past.
Related articles:EA Overfitting (Over-Optimization): How to Detect It Before You Buy
Warning signs include:
- Win rate is too high
- Drawdown is too small
- Almost no losing periods
The more these appear, the more likely it collapses in live trading.
With EAs, it’s often more important to evaluate how it loses than how it wins.
NG2: Underestimating the risk of grid / martingale
Grid (averaging down) and martingale (increasing lot size after losses) can look amazing in backtests and short forward periods.
But they carry an extremely high risk:
one large move against you can destroy the account quickly.
They often fail in the classic way:
“Winning most days, then suddenly everything blows up.”
If the logic includes these elements, you should judge it very carefully.
Related articles:
Why Grid Forex EAs Blow Up: Hidden Drawdowns + Red Flags (Self-Made EA Test)
Martingale EAs: Why They Blow Up (Backtest Proof + Checklist)
NG3: Judging only by win rate or profit factor
High win rate does not mean safe.
Systems that “win small and lose big” can have high win rates and still eventually blow up.
What you should evaluate is the loss profile, including:
- How large is the maximum drawdown?
- Is the worst single loss too large relative to the account?
- Can the system survive losing streaks by design?
NG4: Validation periods are too short (it’s just luck)
If the validation period is short, the market might simply be matching the strategy by chance—
making it look like a “god EA.”
Because markets change, it’s dangerous to judge by short-term performance alone.
At minimum, check multiple years and multiple regimes (trend, range, high-volatility) in both backtests and forward tests.
And especially when buying EAs, you should be extremely cautious.
Conclusion: Indicators Are Not “Signals,” but “Inputs for System Design.” Their Value Is Maximized with EAs
As we’ve seen, the reason it’s hard to keep winning with indicators alone is not only “lag” or “false signals.”
The core issues are:
markets constantly change, and without a complete design that includes
exits, money management, and execution quality, expectancy breaks down.
With discretionary indicator trading, people often trade without validating whether the method truly has an edge.
If rules stay vague and decisions change depending on mood or context, you can’t keep repeating probabilistically favorable actions.
Even if you “hit” short-term, it won’t be stable long-term.
That’s why the correct way to use indicators is not:
“buy/sell when a signal appears,”
but:
quantify market state, select only the right conditions to trade, and adjust risk using indicators as inputs.
Practically, indicators are often most effective when used for:
- Filtering: don’t trade in low-probability conditions (increase no-trade situations)
- Regime classification: switch strategies for trend / range / high-volatility
- Risk adjustment: reduce size or stop in unstable conditions
And what enables you to execute these rules consistently, test them with numbers, and improve them is an EA (automation).
With an EA, you can reproduce the same conditions and run long-term testing in MT5 Strategy Tester.
Instead of “it seems good,” you can judge using data from backtests and forward tests.
But again: EAs are not magic.
No EA wins forever in every market.
Be careful with overly perfect backtests, over-optimization, and the risks of grid/martingale.
What matters is not “finding a magical EA,” but:
running a rule with an edge under a risk design that doesn’t break.
If you feel “I like indicators, but I can’t win,” this is a practical order of action:
- Stop adding indicators and narrow their roles (use them as filters, not entry signals)
- Decide exits (SL/TP) and money management first
- Fix rules in writing, then validate with backtests → forward tests
- If you need consistent execution, automate with an EA
Indicators are not tools that “tell you the correct answer.”
But when combined with an EA and used as inputs for system design,
they can help you concentrate on favorable conditions, control your losses,
and move toward more stable long-term trading.
Frequently Asked Questions (FAQ)
- Q. Are there any indicators that can consistently win?
- A. No. There is no indicator that can keep generating winning buy/sell signals in every market environment.
Indicators are not tools that predict the future; they are tools that quantify market conditions and support decisions.
Whether you can win consistently is determined not by the indicator alone, but by system design—exits (SL/TP), money management, regime selection, validation, and execution. - Q. What’s the best way to use indicators?
- A. Instead of using them as “the correct answer for signal trading,” it’s better to use indicators for filtering, regime classification, and risk adjustment.
For example, you can avoid overheated conditions with RSI, or avoid low-volatility “false breakout” markets with ATR.
If you automate with an EA, you can execute these avoidance rules consistently and validate them as numbers through backtests and forward tests. - Q. If I automate with an EA, will I definitely start winning?
- A. No—EAs are not magic. However, they make it easier to fix rules, eliminate execution drift, and run a continuous test → improve cycle.
That shifts your decision-making from “feel” to “numbers,” making it easier to avoid losing patterns and manage risk properly. - Q. If the backtest is good, is it safe?
- A. Backtests are important, but results can look great due to over-optimization (fitting too tightly to the past).
Ideally, verify across multiple periods and market conditions, and also do forward testing in demo or micro-lots to confirm it doesn’t collapse in live conditions. - Q. Are there any EA characteristics beginners should avoid?
- A. Yes. Be cautious with EAs that show “too high win rate,” “too perfect a curve,” or “extremely large stop losses.”
Also, if the EA uses grid or martingale, it may look great short-term but carries the risk of large losses when price moves strongly against it.