EA Overview
| Martingale | Yes |
|---|---|
| Grid | Yes |
| Scalping | Yes |
| Trading Pairs | XAUUSD |
| Timeframes | 1H |
| Developer | Stanislav Tomilov |

Forward Test (MQL5 Signal) — Current Snapshot | As of Jan 15, 2026
This section summarizes the displayed data from the publicly available MQL5 signal (live forward performance) as a
snapshot as of today. Even if the short-term numbers look strong, they do not guarantee future performance.
A Public MQL5 Signal Adds Basic Transparency
Vortex Turbo X has a public MQL5 signal, allowing third parties to check key behavior such as growth, drawdown, and trading patterns.
That provides a minimum level of transparency for review purposes.
However, a public signal does not guarantee safety—especially when the live history is still short.
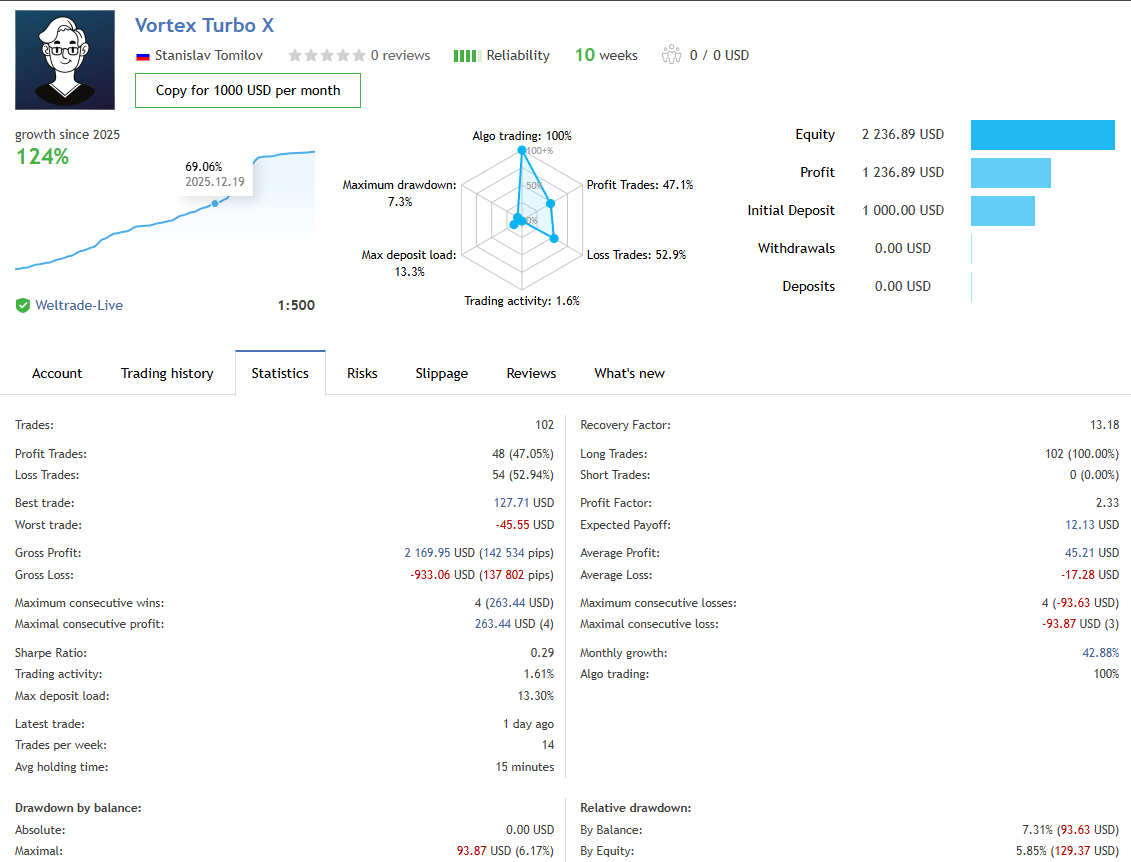
Performance Overview (10 Weeks, +124%)
In the attached forward snapshot, the stats show Reliability: 10 weeks and Growth since 2025: +124%, which looks very strong on the surface.
The initial deposit is 1,000 USD, the displayed profit is +1,236.89 USD, and equity is 2,236.89 USD (as shown at the time of capture).
- Total trades: 102 (about 14 per week)
- Win rate: 47.05% (48 wins / 54 losses)
- Profit factor: 2.33
- Average holding time: 15 minutes (fast turnover = scalping-like)
- Long-only ratio: 100% (0% short)
The win rate is not high, but the display shows average win (+45.21 USD) > average loss (-17.28 USD),
which looks like a “small loss / larger win” profile on paper. Still, this can easily happen over short windows, so it shouldn’t be overtrusted.
Drawdown & Load: The More Important “Shock-Risk”
The maximum drawdown is shown as ~7.3%, and relative drawdown (By Balance) is ~7.31%, which looks controlled on the surface.
Max deposit load is 13.3%, also making it appear that the account is not under excessive stress—at least for now.
However, this is the key caution point.
The official description states that the EA uses a grid + (restricted) martingale.
Structurally, this type of system often makes strong short-term forward results “not surprising”.
By adding positions into floating drawdown (averaging) and taking profit on small pullbacks, the equity curve can look especially smooth during clean market regimes.
On the other hand, during persistent one-way moves or sudden volatility expansion, there is a risk of
rapid drawdown spikes / unexpected large losses.
This “tail risk” is one of the core weaknesses of grid + martingale structures.
Behavioral Clues You Can Read From This Forward
- Fast turnover: ~15-minute average holding time → likely scalping-oriented
- Directional bias: 100% long → performance may fluctuate more with market regime
- Lower win rate: ~47% → profits may be driven more by grid/martingale position management than by “high win rate” logic
Bottom Line (For Now): Looks Good, but “Hold Judgment” Is Reasonable
At the moment, the forward results look well-balanced in terms of growth, PF, and drawdown.
But given the short 10-week history and the grid + martingale premise, it is risky to label this as a “high-quality EA” yet.
What really matters is how drawdown behaves after market conditions change, and how position sizing / account load evolves.
What to Watch Next (For Future Updates)
- How max DD and max deposit load change as the track record gets longer
- Whether there are any single-event “big loss” episodes during sharp market moves
- Whether the EA goes inactive at times, or shows regime-specific weakness
- Whether the long-only bias is temporary or a persistent design feature
Note: This review is based on publicly available information and displayed data as of Jan 15, 2026. It does not guarantee future performance.
Backtest Analysis — Independent Test (2005–2026) | Notes as of Jan 15, 2026
This section summarizes the results of a backtest that I personally ran in the MT5 Strategy Tester.
It is a verification snapshot as of today and does not guarantee future results.
Backtest Settings (My Test Conditions)
- Period: Jan 1, 2005 – Jan 10, 2026 (about 20 years)
- Symbol: XAUUSD
- Initial deposit: 10,000 USD
- Lot size: Fixed 0.01 lot
- Other settings: Default
- Spread: 60 points
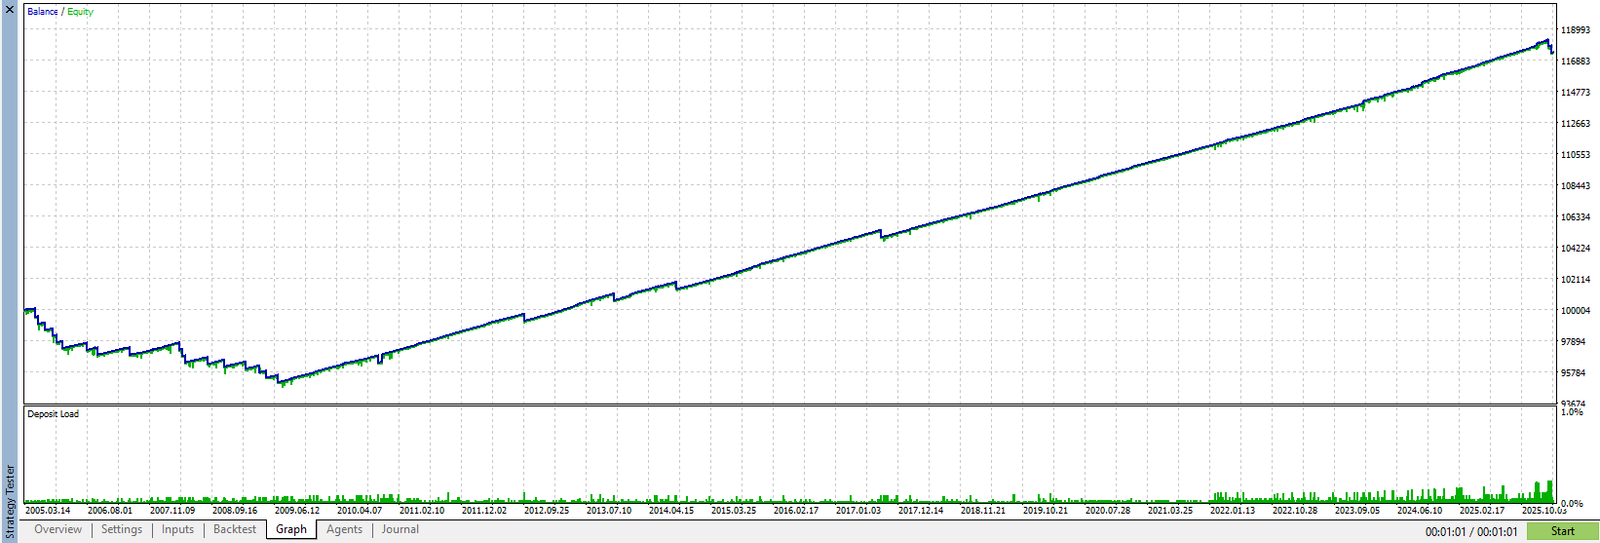
Net Profit Is Positive, but the Early Years (2005–2010) Are Weak
Across the full ~20-year period, the test ends in profit and the long-term equity curve trends upward.
However, the curve clearly shows weaker performance around 2005–2010,
followed by improved performance after 2010.
This “weak early period, strong later period” pattern can reflect market-regime dependence (range/trend/volatility),
and it’s also a common shape for strategies affected by position management such as averaging and staged entries.
It’s important to consider which regimes cause weakness.
Key Stats (Quick Reference)
In this test, the headline numbers were as follows (see the attached report screenshot for details):
- Total Net Profit: +17,450.47 USD
- Profit Factor: 1.75
- Sharpe Ratio: 2.49
- Total Trades: 9,864
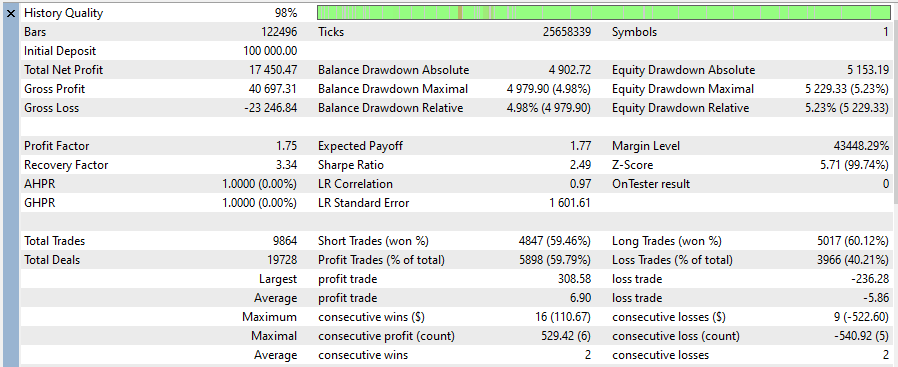
How to Evaluate Drawdown: Not % — Use “Fixed Lot × Absolute USD”
Evaluating drawdown as a percentage of balance can be misleading because it changes with account size and lot sizing.
In this article, I focus on the absolute equity drawdown in USD under a fixed 0.01-lot test.
- Equity Drawdown Absolute: 5,153.19 USD
- Equity Drawdown Maximal: 5,229.33 USD
Critical Point: ~5,229 USD Equity Drawdown Even at 0.01 Lot
This is the most important takeaway from the test.
Even with a fixed 0.01 lot size, the maximum equity drawdown reached about 5,229 USD.
A 10,000 USD starting balance can survive this, but with a small account (e.g., a few thousand dollars or less) it may be difficult.
You cannot conclude “forward looks good = safe.”
With grid/martingale-type designs (including averaging and scaling), returns can look smooth in normal conditions,
but drawdown can expand rapidly when the market becomes one-sided and floating losses build.
Summary: Backtest Results Alone Don’t Prove “Stable EA”
It’s positive that the EA finishes profitable over ~20 years, but:
- Performance is weak in 2005–2010 (possible regime dependence)
- Even at 0.01 lot, equity drawdown reaches ~5,229 USD (heavy capital requirement)
Given these facts, it’s risky to label the EA “low risk” based on the backtest alone.
In the next section, I evaluate the logic (grid/martingale characteristics and averaging behavior) and the associated risk scenarios.
Trading Logic & Risk Characteristics — The Reality of a Grid × Martingale Scalper (As of Jan 15, 2026)
Based on the developer’s description, Vortex Turbo X uses a “controlled martingale” combined with an “averaging grid,” making it an
ultra-short-term scalping EA. Each position has a Stop Loss (SL), but the concept also implies a wider SL to tolerate volatility.
A Scalper That Aims for Tiny Price Moves
This EA does not aim for large single-trade moves. It appears designed to stack profits from very small price targets.
As a result, it tends to be sensitive to spread, execution quality, and latency—meaning performance can vary significantly depending on the trading environment.
The Core Is “Grid + Martingale”: Add More as Price Moves Against You
The developer explicitly states that it is a grid/martingale-type strategy.
In general, this structure often adds positions at very tight intervals as price moves against the initial entry,
pulling the average entry price closer and closing on a modest rebound.
This is a major reason why short-term forward curves can look unusually smooth.
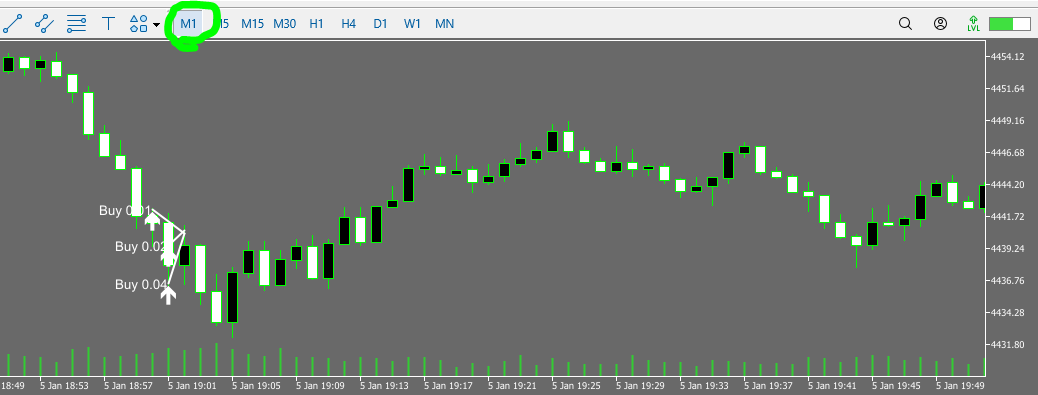
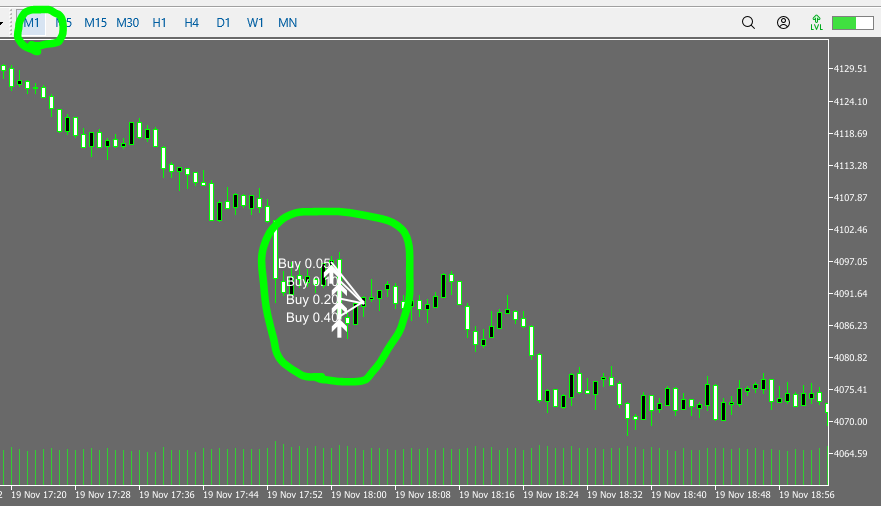
Real Example: Lot-Size Doubling Visible in the Trade Plot
In the attached trade-history plot (forward trade visualization), multiple entries cluster around the same area, suggesting averaging into adverse moves.
The lot sizes also double in the pattern 0.05 → 0.10 → 0.20 → 0.40, which is typical martingale-style scaling.
For this article, the trade-history plot uses white for buys and red for sells.
“It Does Use Stop Loss” — But One Loss Can Still Be Huge
The developer’s stance is that “there is an SL (though relatively wide).”
Even so, the core trait of grid + martingale is that it can build many small wins, but tends to lose big when conditions turn unfavorable.
- The longer price moves against the position, the more positions are added and the larger the total size becomes
- As a result, a single stop-out (or stress event) can produce a very large loss
- If a losing streak hits the strategy, losses can escalate rapidly
Why Environment Matters: Spread, Slippage, and Execution Quality
For ultra-short-term scalping, small differences in trading conditions directly impact expectancy.
With tiny profit targets and frequent scaling entries, the following factors matter even more:
- Spread widening: the thinner the target, the more damaging it becomes
- Slippage: fills can be worse than expected during volatility
- Latency: delays increase mispricing and execution drift, especially during news/fast markets
Operational Takeaway: Don’t Be Fooled by Short-Term Smoothness
Structurally, this EA can “look great” in a short forward window, but it carries unavoidable
tail risk (rare but severe drawdowns).
Because losses can accelerate in losing streaks, small accounts and “set-and-forget” expectations are dangerous.
This section reflects observations as of Jan 15, 2026, and the evaluation should be updated as the forward history extends.
Overall Rating & Summary
This review is based on publicly available information and my own backtest verification as of Jan 15, 2026.
It does not guarantee future performance.
Conclusion (As of Today)
- It’s normal for short-term forward results to look good: Grid + martingale systems often stack small profits in calm conditions, producing smooth short-window curves.
- Baseline assumption: high-risk EA: The structure carries unavoidable tail risk where losses can expand sharply in adverse regimes.
- The backtest also shows warning signs: Performance is weaker in 2005–2010, suggesting regime dependence. Even with fixed 0.01 lot, equity drawdown becomes large—meaning the capital requirement is not light.
- Execution conditions matter a lot: As a scalper, spread, slippage, and latency can easily change the expectancy.
What to Monitor Going Forward
- How max drawdown and account load (position/lot buildup) evolve as the track record grows
- Whether sharp moves or persistent trends trigger “averaging → large loss” episodes
- Whether returns are overly dependent on stacking thin profits (which can fail abruptly)
- Whether performance holds up when market conditions resemble the weaker backtest regimes
Final Note
The current numbers look attractive, but with a grid + martingale structure,
strong short-term results are not “proof of skill” — they are an outcome that the structure can produce naturally.
Be cautious with any purchase or live deployment, and prioritize long-term forward durability (how drawdowns behave) before making strong conclusions.
This is an ultra-short-term scalping EA built on a grid + martingale structure. It can look smooth in the short run, but losses can escalate rapidly during extended adverse moves. Treat it as a high-risk EA.