EA Overview
| Martingale | Yes |
|---|---|
| Grid | Yes |
| Scalping | No |
| Trading Pairs | EURUSD / GBPUSD |
| Timeframes | 15M / 1H |
| Developer | Chen Jia Qi |

[Video Guide] X Fusion AI EA: Verification & Risk Analysis
This article is also available in a detailed video format. It provides a visual summary of the MT5 live behavior and risk dynamics—insights that are often difficult to grasp from data alone.
[Video Overview]
- Forward Analysis: Real-world trading performance and latest results.
- Backtest Analysis: Evaluating resilience against historical market data.
- Risk Profile: Essential precautions to know before you start trading.
Forward-Test Analysis (MQL5 Signal) — Current Snapshot
This section analyzes the forward test (live account) using the signal information publicly available on MQL5 for “X Fusion AI (Chen Jia Qi)” as of Jan 10, 2026.
Because the dataset is short and signal behavior can change depending on the environment, broker, and settings, please treat this as a “snapshot” based on what can be observed today.
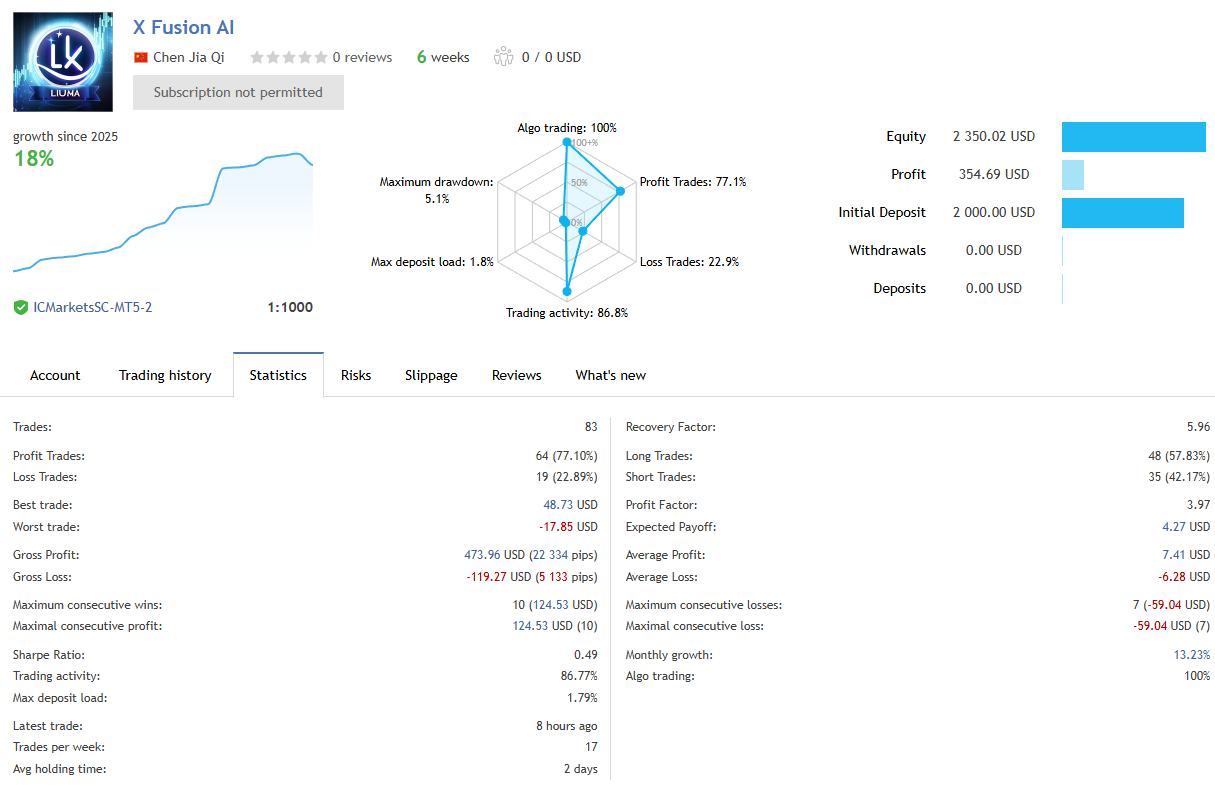
Signal Overview (Key Numbers Visible Today)
- Track record: about 6 weeks
- Growth: about +18% (as displayed)
- Initial deposit: $2,000 / Profit: +$354.69 / Equity: $2,350.02
- Maximum drawdown: 5.1% (as displayed)
- Total trades: 83 / Win rate: 77.10% / PF: 3.97
- Leverage: 1:1000 (as displayed)
On numbers alone, drawdown looks controlled and PF looks high, which can be appealing as a short-term result.
However, a 6-week track record is often not enough to judge long-term stability or resilience during violent market conditions.
If the period does not include major shocks (news spikes, flash moves, sustained one-way trends), the real risk may not have shown up yet.
Key Point: Subscription Restrictions Can Mean “Special Conditions”
The page shows “Subscription not permitted,” which means it cannot be copied under typical subscription conditions.
In many cases, this leads to a situation where “the numbers are visible publicly, but reproducing them under the same conditions is difficult,” so the results should be discounted in a review.
Trade-History Behavior: Many Positions Closed at the Same Timestamp
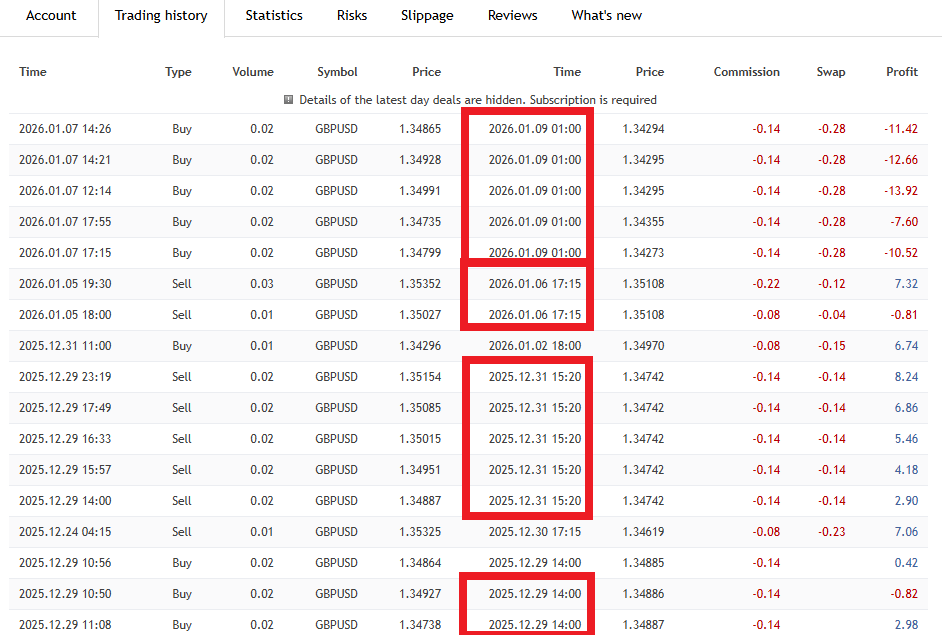
In the trade history, you can see cases where multiple positions are closed together at the exact same time.
For example, several GBPUSD positions were closed simultaneously at 2026.01.09 01:00, and in another period multiple positions were closed at 2025.12.31 15:20.
This “basket close” pattern—build multiple positions → close them together for a combined profit/loss—is commonly seen in systems that manage trades in batches,
and it frequently appears in grid (or averaging/nanpin) type EAs.
It’s not definitive proof on its own, but at minimum you should evaluate it under the assumption that the strategy may have a high-risk structure.
Why “Grid Suspicion” Alone Is Enough to Be Cautious
Grid/averaging systems can look extremely clean in short-term forward results.
But when the market suddenly moves and losses pile up in one direction, losses can accelerate and the strategy may suffer a large one-shot hit (worst case: a full wipeout).
So even if X Fusion AI looks good on today’s numbers, you should treat the mass-close behavior as a strong reason to suspect “this could be a dangerous EA.”
In the next sections (backtest and logic analysis), the key is to check how it behaves during shocks, long range breaks, and sustained trends.
Provisional Takeaway (As of Jan 10, 2026)
- There is a public signal, and the short-term numbers (about 6 weeks) look good at a glance.
- However, repeated basket-style closes at the same timestamp strongly suggest a grid/averaging structure.
- This type often looks “beautiful in the short term” but can fail in the long term, so it should be treated as high-risk and requires caution.
Backtest Analysis (My Own Test: GBPUSD, ~20 Years)
This section summarizes results from a backtest I personally ran using the MT5 Strategy Tester.
Backtests are useful to measure how a strategy fit past price action, but they do not guarantee future profits. Please treat this as my verification result as of Jan 10, 2026.
Backtest Settings (Test Conditions)
- Period: Jan 1, 2005 – Jan 10, 2026 (about 20 years)
- Pair: GBPUSD
- Initial balance: 10,000 USD
- Lot size: fixed 0.01 lot
- Other settings: default
- Spread: 10 points
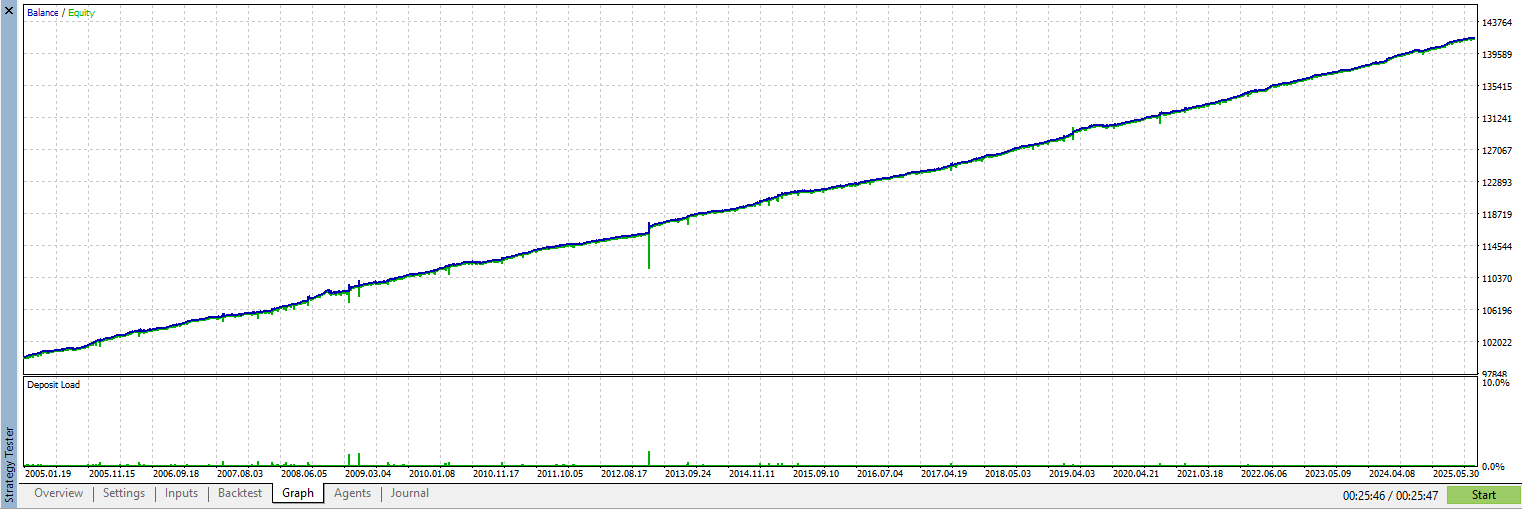
Equity-Curve Shape: A Clean Uptrend Overall, With Sharp Dips
Overall, the backtest graph shows a clean upward slope.
At first glance it looks “steadily profitable,” but there are also periods with notable equity drops (deep downward spikes).
With EAs, you should not judge only by how pretty the curve looks. Always check how deep the equity can sink (i.e., the absolute equity drawdown).
Performance Summary: Large Profit Even at the Minimum Fixed Lot
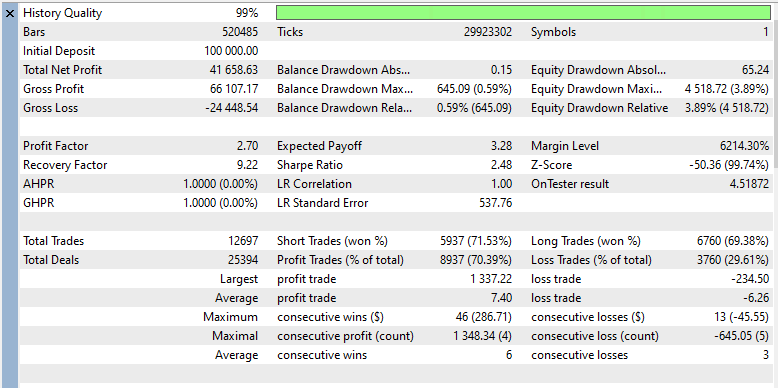
On the tester report, profits accumulated strongly even under this conservative setup (fixed 0.01 lot).
Here is the rough scale (as displayed in the tester):
- Total net profit: about +$41,658
- Profit factor: about 2.70
- Total trades: about 12,697
For a fixed 0.01 lot test, the profit amount is unusually large, which highlights the strategy’s profit potential.
However, it also raises the question of what risk structure produced those returns (batch management, averaging, position stacking, etc.), which must be examined carefully.
Important: Evaluate Drawdown by “Absolute Value,” Not by “%”
Drawdown percentages can look very different depending on the starting balance and lot size, which makes the evaluation unstable.
That’s why this review focuses on absolute equity drawdown.
In this backtest, the maximum equity drawdown (absolute) exceeded $4,000 even with fixed 0.01 lot (tester display).
This is a critical warning. If a similar drawdown occurs on a small account (for example $1,000–$3,000), it can quickly lead to margin issues and forced liquidation, sharply increasing the chance of account failure.
Big Gain, Big Dip: This EA Tends to Require a Large “Buffer”
In short, this EA shows strong profit growth in the backtest, but it also comes with large drawdowns in absolute terms.
A return that you cannot survive through is not a return you can realize.
If you can prepare a large enough account balance, it might be possible to “ride out” drawdowns.
But on a small account, there is a high chance you simply cannot survive the dip, which changes the practical usability dramatically.
Current Conclusion (As of Jan 10, 2026): Not Ideal for Small Accounts
- Over ~20 years, the backtest curve trends upward overall.
- However, even with fixed 0.01 lot, the maximum absolute equity drawdown exceeded $4,000, which is dangerous for small accounts.
- At the same time, profit potential is also large even at the minimum lot size.
- Overall, it tends to assume you can prepare a sufficient balance buffer, so it is not ideal for small accounts.
Trading Logic & Risk Profile (What the Forward Trade-Plot Suggests)
This section organizes what can be inferred from the information available as of Jan 10, 2026 (the developer’s description plus my observation of the forward trade-history plots).
The trade-history charts are plotted from the forward signal (white = Buy, red = Sell).
Core Pattern: Strong Signs of a Grid/Averaging (Nanpin) Structure
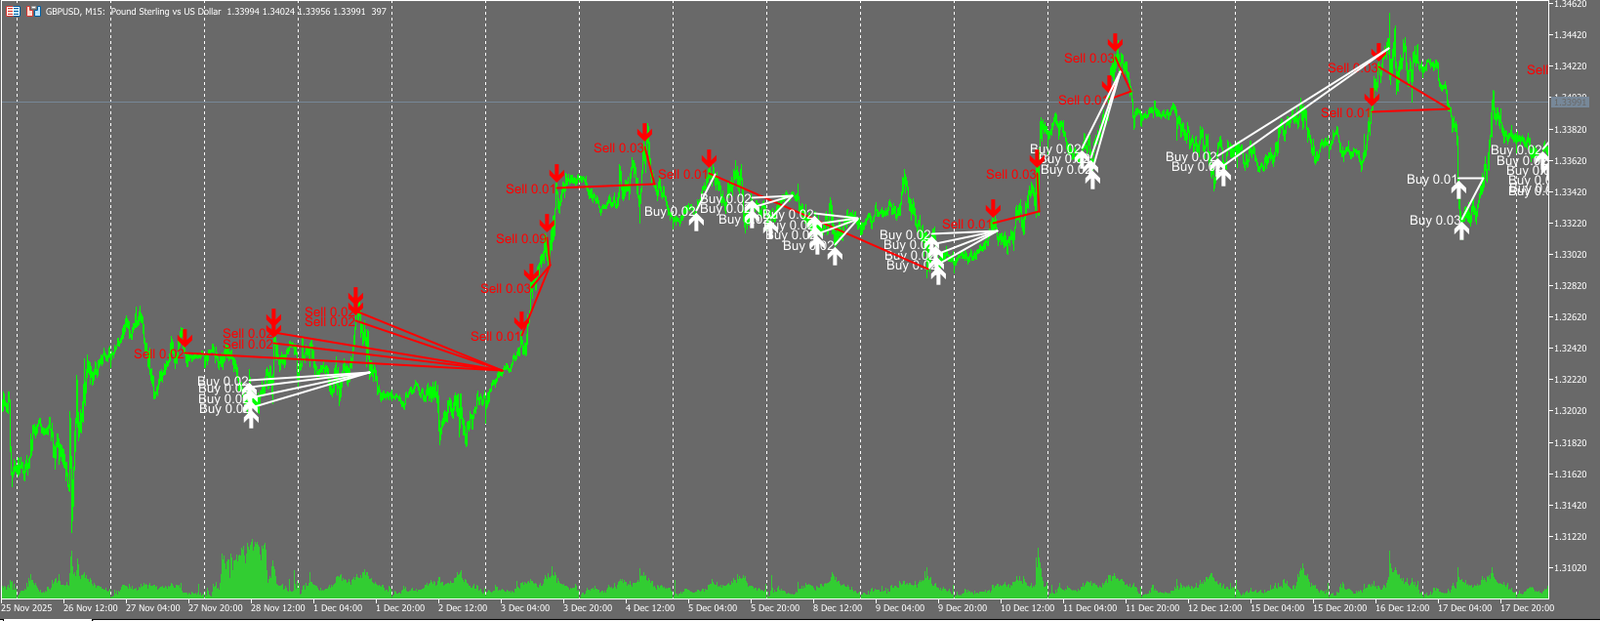
On the chart, you can see multiple positions being added in the same direction, especially when price moves against the initial entry.
This is a common footprint of grid (averaging/nanpin) systems.
You can also see clusters of positions being closed together, which suggests the EA may be managing P/L via basket (batch) management.
Lot Behavior: Sometimes It Increases, Sometimes It Doesn’t
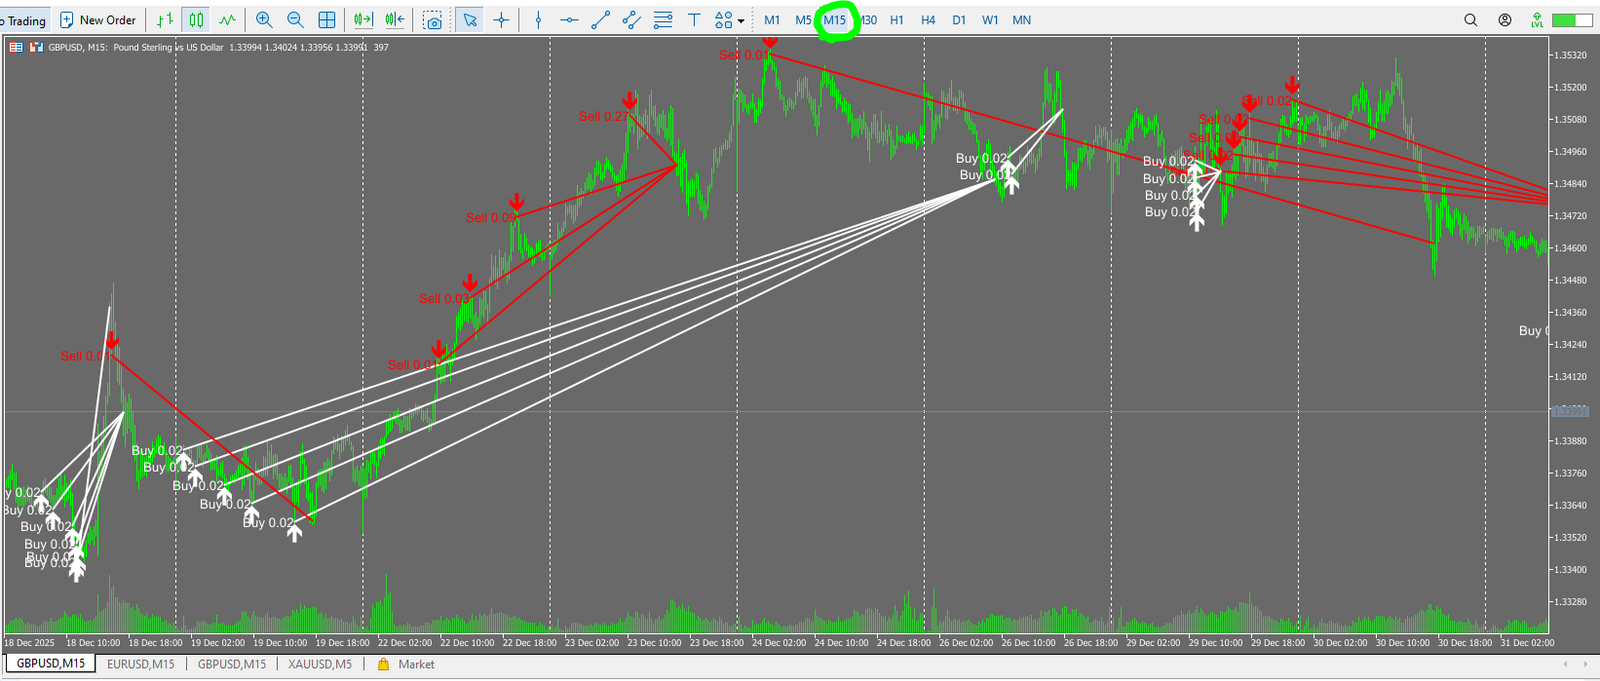
During averaging (adding positions), there are moments where lot size becomes larger, suggesting a martingale-like element (increasing size to recover losses).
At the same time, there are also periods where the EA adds positions without increasing lot size, so it may be adjusting size based on internal conditions rather than using a simple fixed multiplier.
Still, the fact that lot increases appear at all means risk can expand quickly during sudden moves.
A Key Difference vs Typical “Hold-Until-Positive” Averaging EAs: It Does Cut Losses
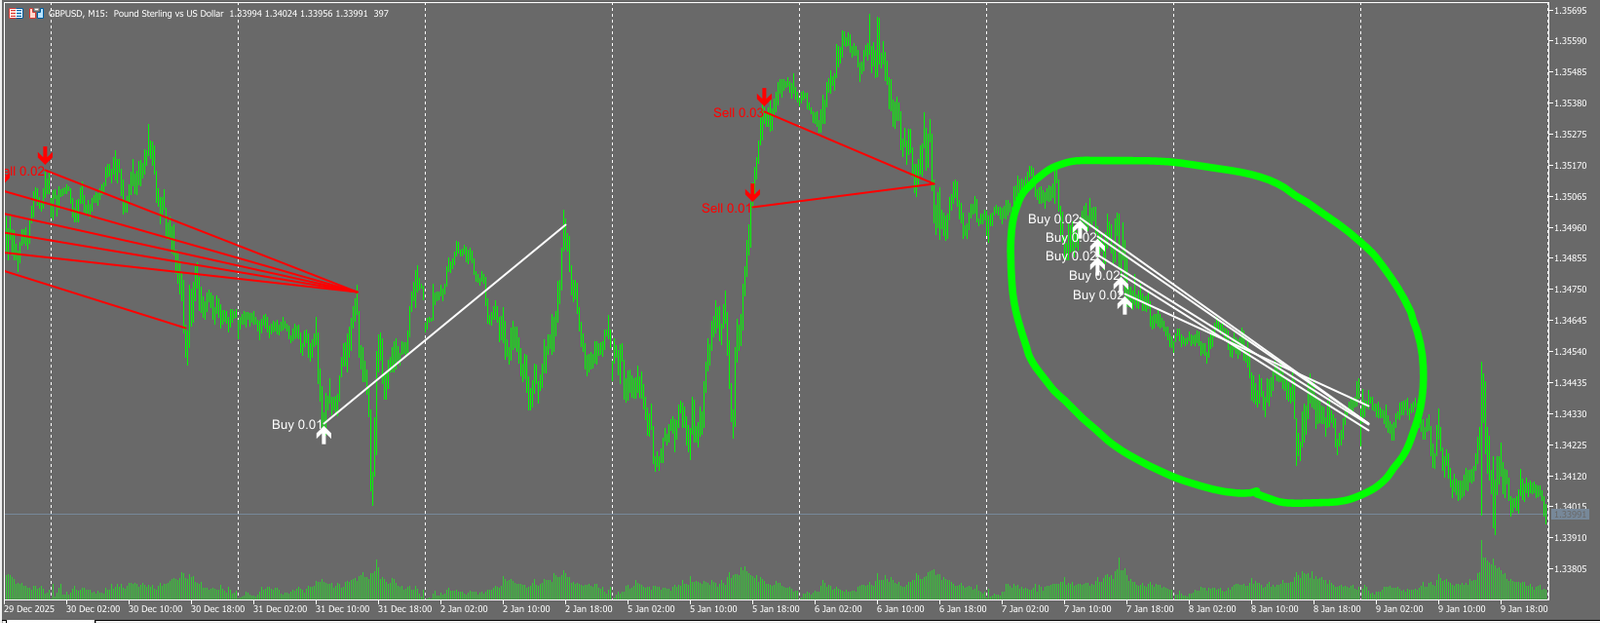
An important observation is that there are moments where the EA cuts losses (stop-loss).
Many classic averaging EAs keep holding until the combined net P/L turns positive, but this EA shows behavior that “cuts” under certain conditions.
This may indicate more rules than a pure “infinite averaging” model, but it does not automatically make it safe.
As long as it uses averaging + (sometimes) martingale-like sizing, the strategy can still take severe damage in fast, one-way markets.
Developer’s Description (Organized as “What the Developer Claims”)
The developer generally emphasizes the following points (summarized here as claims):
- An “adaptive” approach that evaluates market conditions and adjusts internal behavior
- Multiple market states such as trend/volatility are considered
- Risk controls and filters (DD management, protection features, news filters, etc.)
- Depending on the version, optional external AI/LLM integration
However, what matters in a review is not the claims, but the behavior.
From the forward plots, you can see grid/averaging footprints and, in some situations, lot increases (martingale-like).
Risk Summary: It Cuts Losses, But Still Should Be Treated as High Risk
- The entry/adding pattern strongly suggests grid/averaging (nanpin).
- Lot size sometimes increases and sometimes doesn’t, implying conditional sizing.
- It does cut losses at times, which differs from “hold-until-positive” averaging EAs.
- Even so, averaging + martingale-like elements can expand losses rapidly, so it should be treated as high risk.
Overall Verdict & Summary (As of Jan 10, 2026)
This review is based on what can be confirmed as of Jan 10, 2026 (the public MQL5 signal, my backtest, and observation of the forward trade-history plots).
Bottom Line (Key Takeaways)
- Short-term forward results look good, but the track record is only about 6 weeks, which is not enough to judge long-term stability.
- The trade history shows basket-style mass closes at the same timestamp, strongly suggesting a grid/averaging structure.
- There are moments of lot increases (martingale-like), which raises the risk of a one-shot hit during sudden moves.
- It also shows stop-loss cuts, which may differ from classic “infinite averaging,” but it does not remove the core risk.
- Overall, it should be treated as a high-risk EA as long as averaging and martingale-like sizing exist.
What the Forward Signal Suggests
- Growth and PF look attractive on paper.
- But due to the short period and subscription restrictions, reproducibility and generality should be discounted.
- Basket-style behavior suggests structural risk cannot be ignored.
What My Backtest Suggests
- Over ~20 years, the curve trends upward overall.
- However, even at fixed 0.01 lot, the maximum absolute equity drawdown exceeded $4,000, which can be hard to survive on small accounts.
- Big profit potential, but also big dips—this tends to require a large capital buffer.
Who It May Fit / Who Should Avoid It
- May fit: traders who can prepare sufficient capital and are willing to validate it carefully (settings, broker conditions, shock periods).
- Should avoid: small accounts, “stable income” goals, or anyone who cannot tolerate deep drawdowns.
Final Rating (Current)
- Forward results look strong, but both the trade-plot and the backtest suggest a high-risk structure.
- Not a good match for “safe growth” with small capital.
- If you run it, do so only with large capital + strict validation (settings differences, shock scenarios, stop conditions).
Based on the trade history and chart behavior, it shows grid/averaging (nanpin) and, depending on the situation, lot increases (martingale-like). Even though it does cut losses, a sudden market move could still break the strategy quickly, so I rate it as a high-risk EA.