EA Overview
| Logic Overview | Trend-following |
|---|---|
| Martingale | Yes |
| Grid | No |
| Scalping | Yes |
| Trading Pairs | XAUUSD |
| Timeframes | 5M / 1H |
| Developer | Hicham Chergui |

[Video Guide] Nova Gold X EA: Verification & Risk Analysis
This article is also available in a detailed video format. It provides a visual summary of the MT5 live behavior and risk dynamics—insights that are often difficult to grasp from data alone.
[Video Overview]
- Forward Analysis: Real-world trading performance and latest results.
- Backtest Analysis: Evaluating resilience against historical market data.
- Risk Profile: Essential precautions to know before you start trading.
Forward Test (Live Trading) Analysis: What We Can See as of Jan 10, 2026
Note: This section reflects the forward results available as of the publication date (Jan 10, 2026). It does not guarantee future performance. Results can vary significantly depending on trading conditions such as broker, spread, execution quality, settings, and whether the EA is paused and resumed.
The forward is not publicly available on Myfxbook or MQL5 Signals
Nova Gold X does not provide a publicly trackable forward page like a typical Myfxbook link or an MQL5 Signals URL. To view it, you need an MT5 “investor password” (read-only login).
I personally logged into MT5 with the investor credentials and reviewed both the performance and the trade history (i.e., I could directly confirm the P/L and trade records shown on the platform).
The M5 account started in Dec 2025 is currently positive, but it must be read with context
The M5 account I could verify started in December 2025 and is currently profitable. To understand the big picture (P/L, Profit Factor, drawdown, and the equity curve), I first checked the summary and the growth curve.

That said, “good short-term forward” does not automatically mean “safe.” Gold EAs (XAUUSD) can flip quickly during sudden moves or spread expansions, so checking the “how” behind the results is critical.
Trade history shows the lot size becomes 3x after losses
When I traced the lot size sequence in the trade history, I found cases where the EA traded at 0.01 lots, then entered at 0.03 lots (3x) immediately after a streak of losses.

Regardless of what it is called, this behavior is essentially “increasing size to recover losses,” a classic pattern that makes performance increasingly dependent on martingale-style recovery. It can help the curve look smoother in the short run, but if price keeps moving against the position, drawdowns can accelerate. This is a common warning sign for high-risk EAs.
Be cautious: it looks like it avoids drawdown periods despite being high-frequency
Nova Gold X appears to trade at a very high frequency, yet based on the chart behavior and order markers, there are strong-downside phases where trading becomes thin. As a result, it can look as if drawdowns are being avoided.

However, this point is difficult to judge:
- It may be a risk filter built into the EA’s logic, or
- It may be discretionary pausing to avoid “dangerous” phases.
At this stage, I cannot conclusively determine which it is. But since the long-run backtest did not clearly show consistent avoidance of prolonged downtrends, it would be premature to credit the forward alone as proof of robust avoidance logic. If manual intervention is involved, the results may not be reproducible, and transparency becomes a concern.
Conclusion so far: profitable now, but strong signs of “lot increase = martingale dependency”
The forward results are currently positive as of Jan 10, 2026. However, because the trade history shows stepped lot increases (3x entries after losses), I consider it highly likely that performance depends on martingale-style recovery (or something very close to it).
This kind of strategy can look strong when price oscillates within a range, but the failure risk can jump sharply when a one-directional trend extends. In the next section (Backtest Analysis), I will examine whether the same “recovery logic” can become fatal over the long run.
Backtest Analysis: What I Found from My Own Testing (as of Jan 10, 2026)
Note: This section summarizes results from my own MT5 Strategy Tester runs as of Jan 10, 2026. Backtests do not guarantee future performance. Outcomes can vary greatly depending on broker conditions (spread/execution/fees), historical data quality, settings, and whether the EA is paused during certain periods.
Test setup (my backtest conditions)
- Symbol: XAUUSD
- Timeframe: M5
- Period: from 2005 (long-term)
- Settings: default settings as the baseline
- Spread: 20 points (fixed)
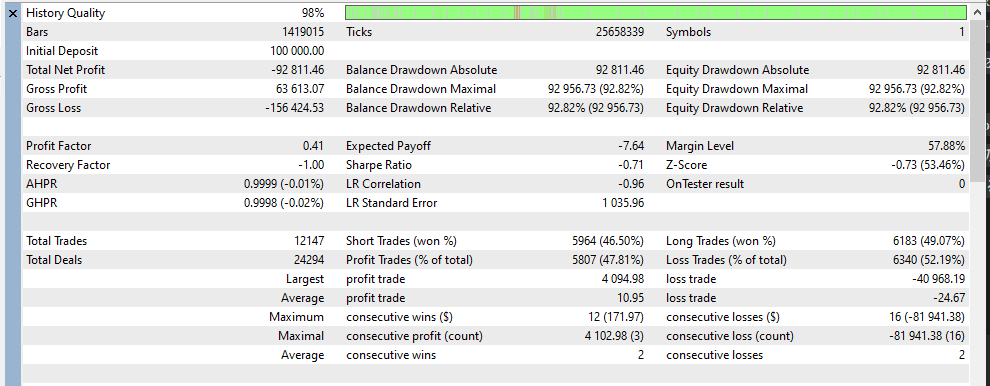
- History quality: 98% (as shown in MT5)
Conclusion: the long-term test with default settings was extremely bad
First, I ran a long-term backtest on XAUUSD, M5, using the default settings from 2005 onward. The balance/equity curve trended downward consistently, and profitability could not be confirmed. Even if some short windows look fine, the long-run behavior is that losses accumulate.


The report also shows negative net profit and a Profit Factor below 1. In plain terms, the results suggest the strategy may have a negative edge over the long run.
How I evaluate drawdown: not by % but by lot assumptions and absolute equity DD
Drawdown “percentage” is highly sensitive to lot sizing and starting balance. Even a small change in lot size can swing %DD dramatically, so it is not a stable way to assess real risk.
In this review, I focus on:
- What lot sizing method is assumed (fixed vs. compounding)
- Absolute equity drawdown (currency amount)
Even under the default settings test, the absolute equity drawdown was large and the account balance eroded over time. This is not a “set-and-forget, steady growth” profile.
When martingale-style recovery is enabled: it may look good early, then becomes fatal later
Next, I reran the test with the recovery feature enabled (a mechanism that increases lot size after losses). In the input parameters, recovery is triggered after a certain number of losses, and the lot size is increased by a multiplier (e.g., 2.0).
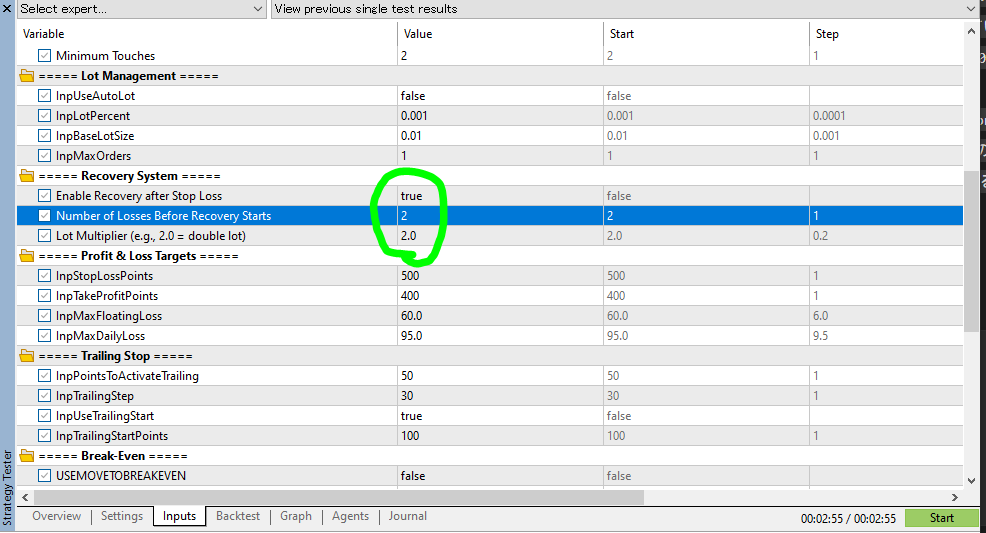
Under this configuration, performance can look stable in the early to mid period. Losses are easier to “recover” via larger sizing, and the curve can look smoother.
But once market conditions shift and price keeps moving against the strategy, the same lot increases can backfire. In my test, a very large absolute equity drawdown appeared later, and the chart clearly shows the moment the account breaks down.
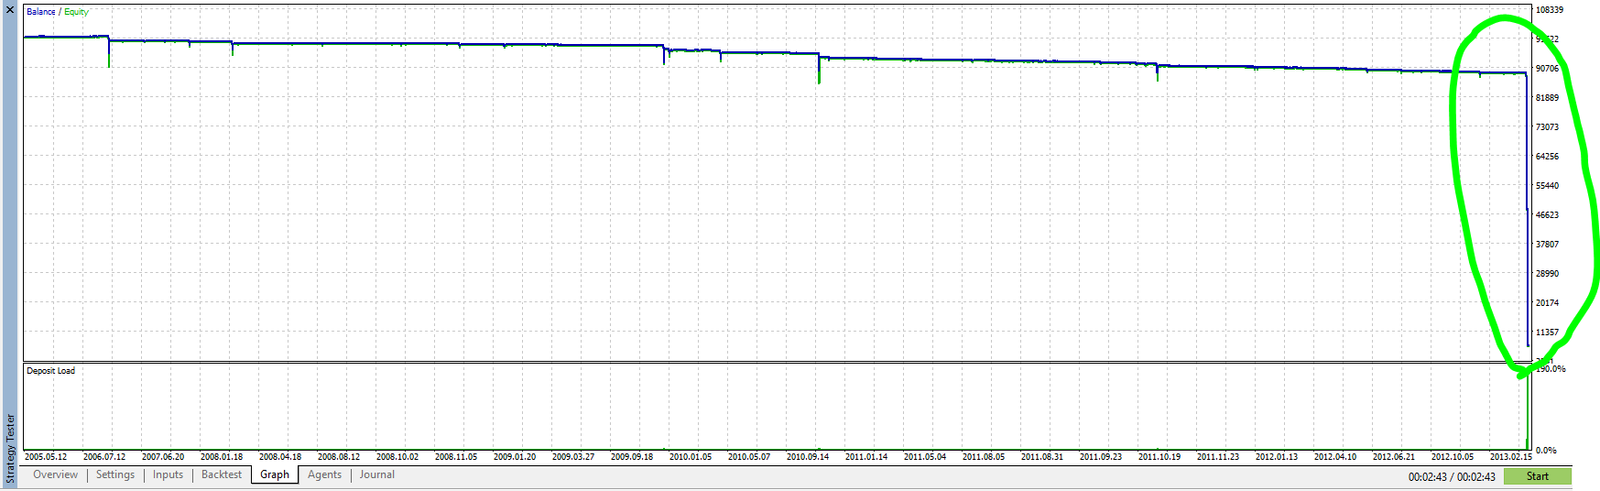
The report numbers also reflect this: net profit turns sharply negative, the largest loss trade grows, and the “recovery” feature can function less like insurance and more like an explosive risk amplifier.
Why it is dangerous: martingale tends to “win small, then lose big”
Martingale-style recovery increases position size as losses accumulate. That often creates the illusion of consistent wins in short windows. But when a major adverse trend arrives, it can wipe out prior gains in a single hit. This is the core risk.
My test reproduced that pattern. From a backtesting perspective, Nova Gold X appears prone to relying on recovery lot increases, so the risk assessment should be strict.
Summary of the backtest findings
- The long-term backtest (default settings, XAUUSD, M5, from 2005) performed extremely poorly.
- Risk should be assessed by lot assumptions and absolute equity drawdown, not by %DD.
- Enabling recovery (martingale-like) can look good early, but may lead to fatal drawdowns later.
- A “good short-term forward” is not enough; long-run blow-up risk must be taken seriously.
Trading Logic & Risk Characteristics
Note: This section summarizes (1) what the developer claims in the official description and (2) what I observed in the forward and backtests. Since the internal code is not public, this is an evidence-based assessment—not a definitive statement of the exact algorithm.
Developer’s claims: price-action driven, high-frequency scalping style
According to the developer, Nova Gold X is an “AI”-based, price-action-driven EA that does not rely on lagging indicators. It mainly targets XAUUSD (Gold), recommends lower timeframes such as M5, and is positioned as a very high-frequency, scalping-oriented system.
Developer’s claims: no grid, but a recovery feature is available
The official description includes safety-oriented phrases such as “not a grid” and “each trade has a stop loss.” At the same time, it also mentions a “Recovery” feature designed to increase lot size after losses to recover.
Even if it is called “Recovery,” the structure of increasing size after a loss is commonly categorized as martingale (or martingale-like) behavior.
Observed behavior: no grid, but performance appears “martingale-dependent”
From the trade history I reviewed, there are situations where the lot size increases after consecutive losses (e.g., 0.01 → 0.03). This is consistent with a “recover losses by increasing size” approach, suggesting that the results may depend heavily on martingale-style recovery.
In short, you may not see classic grid stacking, but the strategy still relies on increasing lot size during losing streaks—making it effectively martingale-driven.
Why it’s risky: it can look smooth—until it doesn’t
The core danger of martingale-style recovery is straightforward:
- In normal conditions, wins accumulate and performance looks clean.
- During extended adverse moves, position size grows and losses accelerate.
- One strong trend can wipe out months of gains (or severely damage the account).
My backtest results align with this pattern: recovery-enabled tests can look stable early on, but later show very large drawdowns. This matches the typical “martingale eventually breaks” risk profile.
Extra risk for high-frequency systems: spread, execution, and manual intervention
With many trades, transaction costs (spread/fees/slippage) matter more. In addition, pausing an EA during dangerous periods can make performance look better than what a true “hands-off” run would produce. If manual intervention is involved, reproducibility drops.
In this case, the forward distribution sometimes looks like it avoids downside phases, but it’s unclear whether that is logic-based filtering or discretionary stopping. That uncertainty alone is a negative for transparency and reproducibility.
Bottom line: no grid doesn’t mean safe—martingale dependency is still extremely dangerous
Nova Gold X does not appear to stack losing positions horizontally like classic grid systems. However, because I could confirm lot-size increases after losses (recovery), it effectively behaves like a martingale-based strategy. That makes the risk profile extremely aggressive.
Even if the short-term forward looks good, it may simply not have faced the “failure regime” yet. Anyone considering this EA should realistically stress-test worst-case scenarios—loss streaks, sudden spikes, and spread blowouts—and assume that a single event can erase prior gains.
No grid behavior is visible, but I confirmed “recovery” entries where the lot size increases after a loss (effectively martingale-style). Even if it looks good in the short term, a sudden move can break the equity curve quickly. Overall risk is high.