EA Overview
| Logic Overview | Mean Reversion |
|---|---|
| Martingale | Yes |
| Grid | Yes |
| Scalping | No |
| Developer | FOREX STORE |

Forward Test Analysis (Myfxbook) — Current Snapshot
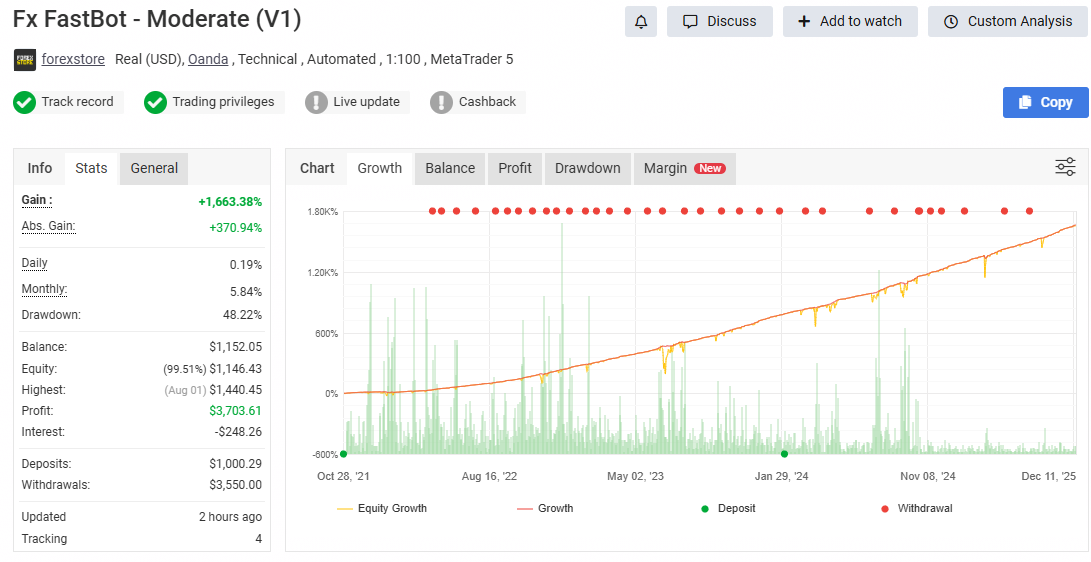
This section is a provisional evaluation based on publicly visible Myfxbook forward data available as of today (2025/12/27).
Because forward performance can change dramatically with market conditions, please read this as a “current snapshot.”
Key Metrics at the Time of Writing (Moderate V1 / AUDCAD)
- Gain: +1,663.38%
- Monthly: 5.84%
- Drawdown: 48.22%
- Balance: $1,152.05 (Equity: $1,146.43)
- Profit: $3,703.61
- Deposits: $1,000.29 / Withdrawals: $3,550.00
- Updated: 2 hours ago (as shown on the page)
The equity curve looks smooth and steadily rising, but the maximum drawdown is roughly 48%.
That strongly suggests a structure that “accumulates small wins in normal conditions, then sinks deeply in bad phases.”
Balance Growth Can Create a “False Sense of Stability” (Deposits, Withdrawals, Compounding)
This vendor account has already built up profits and has also withdrawn funds (withdrawals appear larger than deposits).
In general, grid/martingale systems become less likely to blow up as the balance cushion grows.
In other words, once an account has grown, the same logic can look safer because:
- there is more margin room to withstand floating losses, and
- the system can survive a wider adverse move (time and pips).
As a result, “stability” can be overstated visually. On the other hand, if you copy the same settings with a small starting balance,
the probability of reaching zero (blow-up) can jump sharply.
What the Trade History Implies: Grid (Averaging Down) + Martingale
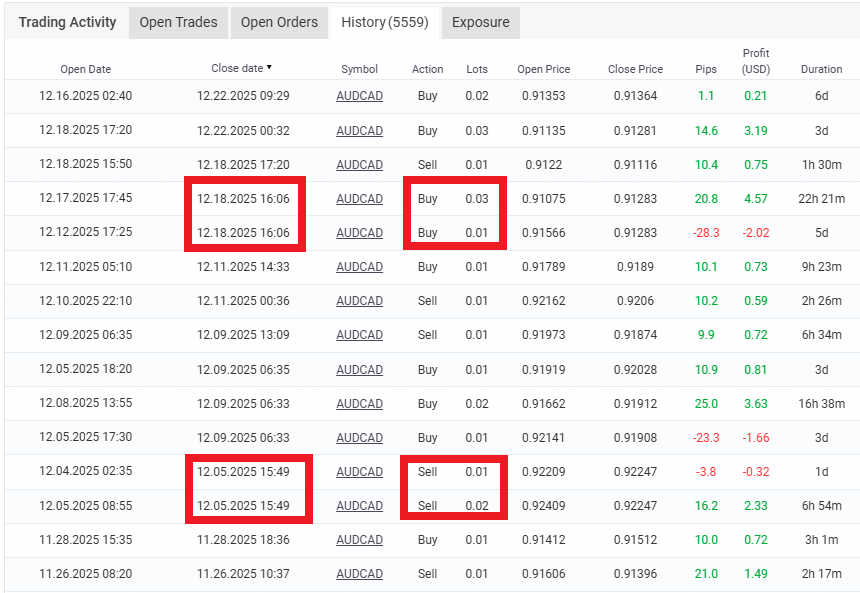
Looking at pips, P/L, and lot changes, the behavior appears consistent with a classic grid + martingale approach.
For example, on the same symbol (AUDCAD) you can observe:
- multiple positions opened within a short time window,
- multiple trades closing at the same timestamp,
- lot sizes changing like 0.01 → 0.02 → 0.03 (increasing in certain phases),
- many small wins around 10–20 pips, mixed with losses around -20 to -30 pips.
This matches the typical grid pattern of building positions at intervals and exiting as a batch.
And since lots increase in some phases, it suggests martingale mechanics (raising size to recover losses).
Main Weakness: “Blow-Up Risk” in a Strong One-Way Trend
The biggest weakness of grid/martingale is straightforward: it is highly vulnerable when a large one-direction trend occurs.
In ranges, it can keep taking small profits. In trends, position build-ups grow, floating loss expands, and margin requirements snowball.
Even in this forward account, drawdown has reached about 48%, implying there were already “dangerous sink” periods.
With this structure, it is not rare that the system “survived by luck once,” but may not survive the next similar trend.
Possible Survivorship Bias: Showing Only the “Survivor” Account?
Even with the same logic, survival vs. blow-up can diverge greatly depending on:
start timing, spread, execution quality, account size, and broker conditions.
This creates an environment where a vendor may:
- run many forward accounts and many settings, then
- show only the accounts that happened to survive.
If you run enough forward tests, it is natural that some grid/martingale variants will “survive.”
That is why it is dangerous to judge safety from a single clean equity curve.
Interim Takeaway (Forward Only)
As of today, the forward results show strong returns. However, the trade behavior indicates a
high-risk grid (averaging down) + martingale structure.
It can perform while conditions fit, but the key concern is a potential one-shot collapse during a major trend.
In the next section (backtest analysis), the focus should be long trend periods (multi-year),
checking maximum adverse move, maximum open positions, lot ceiling, and whether “account-zero” events occur,
to evaluate whether the forward performance has real robustness.
Trading Logic & Risk Characteristics
This section compares the developer’s public explanations (their claims) with what we can observe from the current forward behavior (trade-plot history),
to summarize the likely logic direction and risk profile.
What the Developer Claims (Organized Summary)
- Primary focus: AUDCAD (some profiles may add other pairs)
- Style: designed for short holding times (often closed within hours or within the day)
- Take-profit concept: relatively small TP (e.g., around 10 pips) with indicator-based adjustments (e.g., Envelopes)
- Spread handling: claims to reduce/avoid entries during spread expansion
In short, the message is “small wins, many cycles.” But these are claims—real risk is determined by how positions are built
(averaging, lot progression, and total simultaneous exposure).
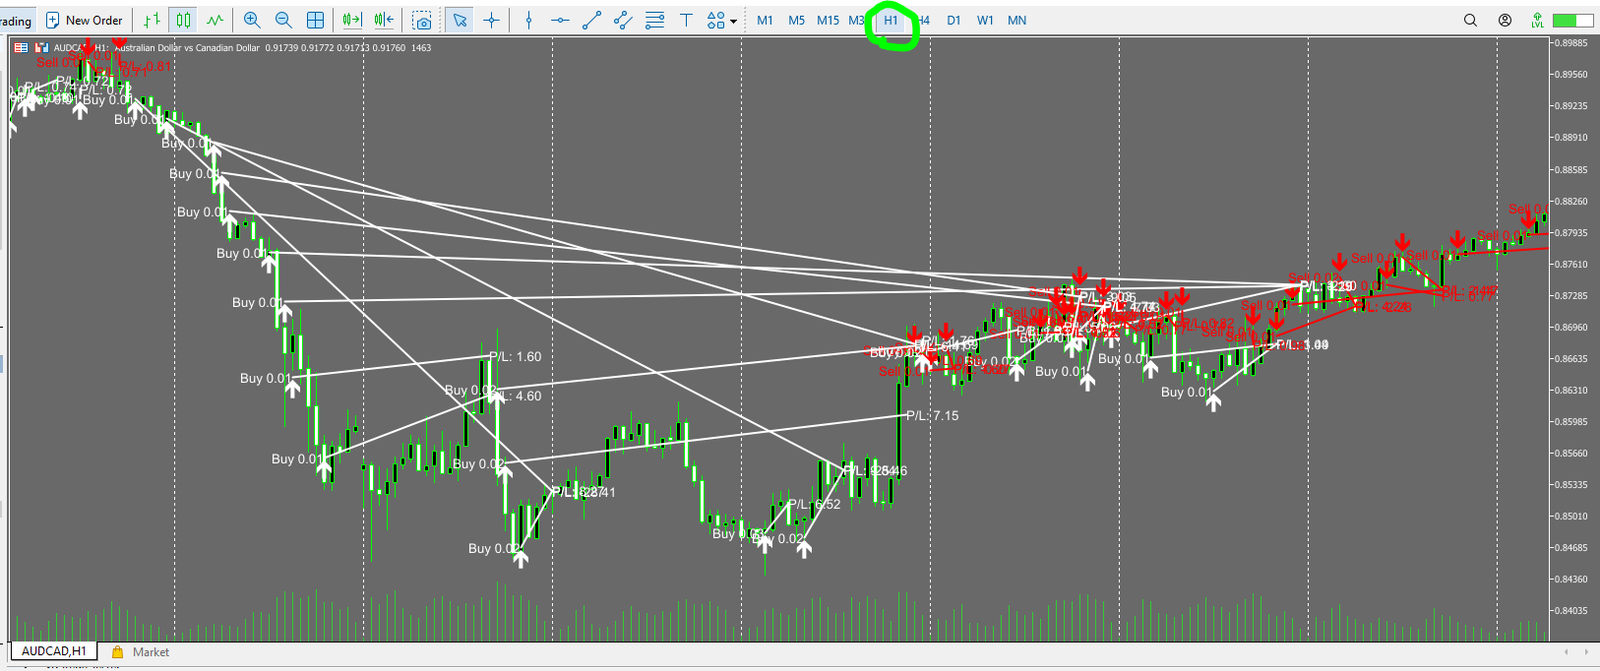
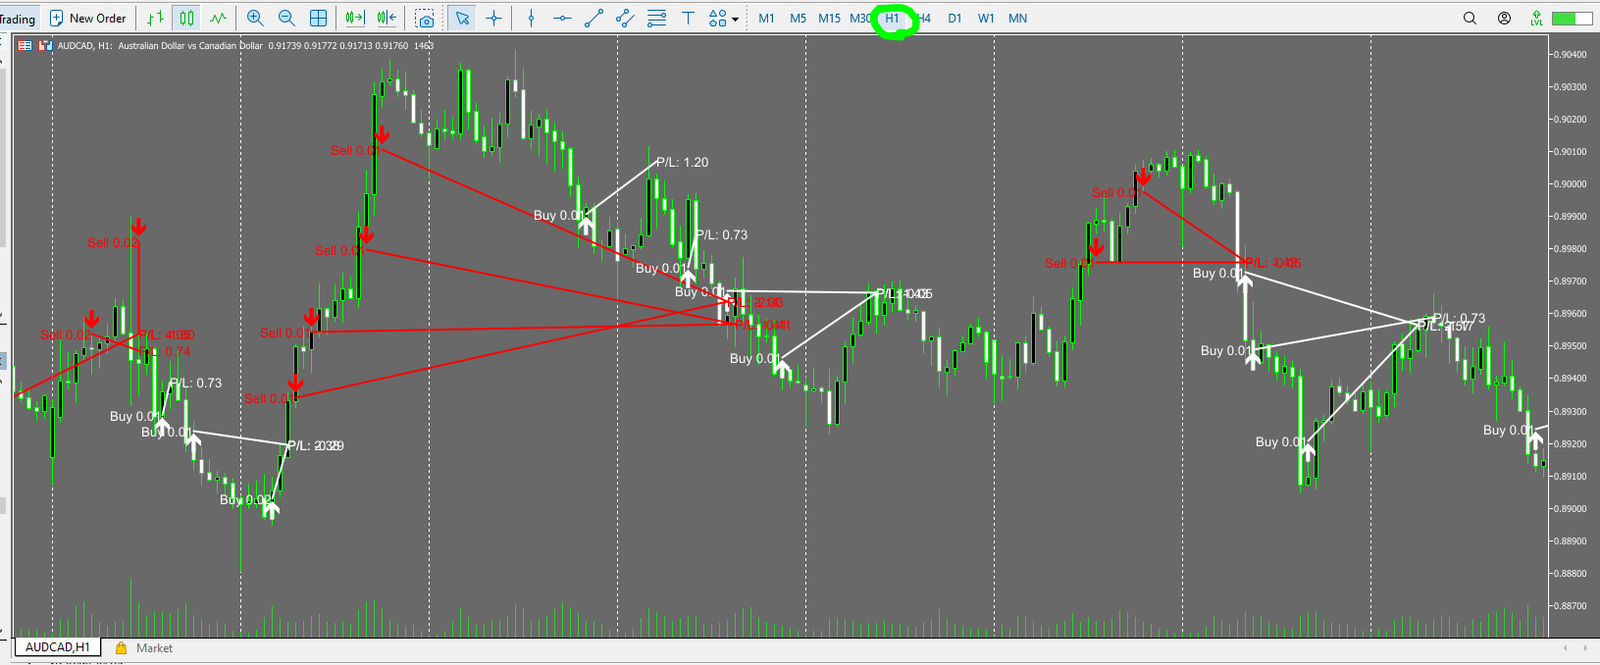
What the Forward Trade-Plot Shows (White=Buy, Red=Sell)
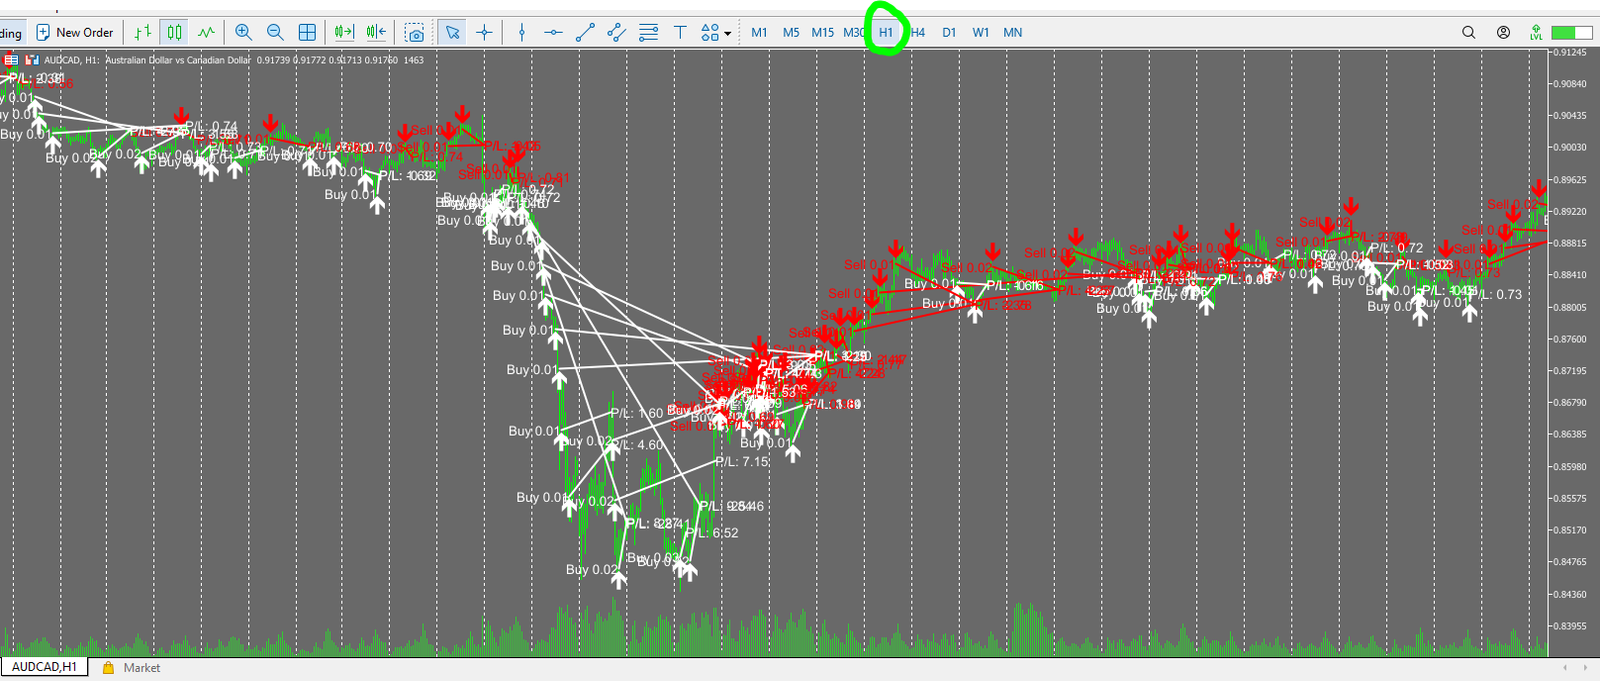
The attached plot visualizes forward trade history (white = Buy, red = Sell).
From this, you can infer:
- entries tend to cluster in the same direction within short periods,
- the number of open positions can jump quickly,
- when a trend develops, positions on the wrong side can accumulate and the system may “hold and hope.”
Bottom Line: Grid (Averaging Down) × Martingale Is Extremely Dangerous
Combining grid (averaging down) with martingale is widely considered one of the most dangerous structures.
It can look stable while taking frequent small profits, but when a strong one-way trend appears,
position build-ups expand floating losses and margin requirements rapidly—raising the probability of an “account-blow” scenario.
“Only One Averaging Step per Entry” Does Not Guarantee Lower Risk
Even if the system limits averaging to “one additional entry per initial trade,” that alone does not make it safe.
The reason is simple: as shown in the plot, the total number of entries is high, so total exposure can still balloon.
- Even with limited averaging per trade, a high volume of fresh entries increases total positions.
- In trends, losing positions that cannot exit accumulate over time.
- This can lead to declining margin level and, eventually, forced liquidation.
Common Failure Pattern on H1 (1-Hour Chart)
All attached charts are on H1 (1-hour). While it may catch short rebounds and take profits,
when a trend persists, positions on the wrong side can keep increasing.
This is a classic weakness: “strong in ranges, fragile in trends.”
Section Takeaway
The developer emphasizes short-cycle profit taking, but the forward trade-plot strongly suggests a
high-risk grid (averaging down) + martingale-like structure with frequent entries.
Even with a one-step averaging limit, total exposure can grow, making “one-shot collapse” a realistic risk in trend phases.
Overall Verdict & Summary
This is a provisional review based on forward data and trade behavior observed as of 2025/12/27.
Because performance can vary with market and broker conditions, the evaluation may change as new data accumulates.
Bottom Line (Key Points)
- High returns, but a grid (averaging down) + martingale-type EA.
- Often strong in ranges, but high risk of “one-shot blow-up” in a one-direction trend.
- Even if averaging is “limited to one,” frequent entries can inflate total exposure—risk is not truly reduced.
How to Interpret the Forward Results
- A smooth curve does not mean safety—large drawdown signals dangerous sink periods.
- The vendor account has a larger balance cushion, which can reduce blow-up odds.
- With small starting capital, the probability of reaching account-zero can rise sharply.
Survivorship Bias Risk
- If many accounts/settings are run, some grid/martingale variants will naturally “survive.”
- A vendor may show only the surviving account.
- Do not judge safety from one clean equity curve.
Who This Might / Might Not Fit
- Not recommended: anyone seeking stable, long-term capital growth.
- Only for: traders who fully accept blow-up risk and treat it as a high-risk bet.
What to Verify Next (Backtests / Extra Checks)
- Maximum simultaneous positions and maximum lot size (how large it gets in trends)
- Maximum adverse move (pips) and worst floating loss (MAE)
- Whether long backtests show account-zero / margin call events
- Behavior during spread spikes and news volatility
Overall, FX FastBot can look strong when conditions fit, but it also carries a high probability of total collapse in adverse trend phases.
Do not rely on the headline return numbers—evaluate it under the assumption that the worst case (account blow-up) can happen.
The forward trading behavior strongly suggests a grid (averaging down) + martingale style. Drawdown is large, and this type can collapse in a strong one-way trend. Not suitable for anyone who cannot tolerate “account-blow” risk.