EA Overview
| Logic Overview | Mean Reversion |
|---|---|
| Martingale | Yes |
| Grid | Yes |
| Scalping | No |
| Developer | FOREX STORE |

Forward Test Analysis (as of December 24, 2025)
Nearly Two Years of Forward Testing with a +799% Return
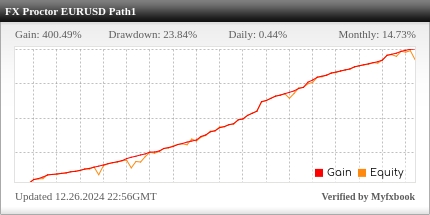
The Myfxbook forward test for FX Proctor EURUSD Path1 shows almost two years of real-account data, from late December 2023 through December 2025. Starting from an initial balance of $1,000, the current profit is about $7,991, for a total gain of +799%, which is an extremely high figure. The average daily return is 0.30% and the average monthly return is 9.58%, making the performance look very attractive in terms of raw numbers.

The growth and equity growth curves trend upward overall, with some sizable drawdowns along the way. The maximum drawdown is 32.57%. For a grid-type EA this is not “catastrophically deep,” but it is still a level that cannot be taken lightly. Even so, the balance has steadily increased over the forward period and has grown to roughly nine times the original size, which is naturally appealing to many investors.
Grid & Martingale Structure Seen in the Trade History
However, when you look closely at the Myfxbook trade history, it becomes clear that this EA’s logic is a classic grid & martingale system.
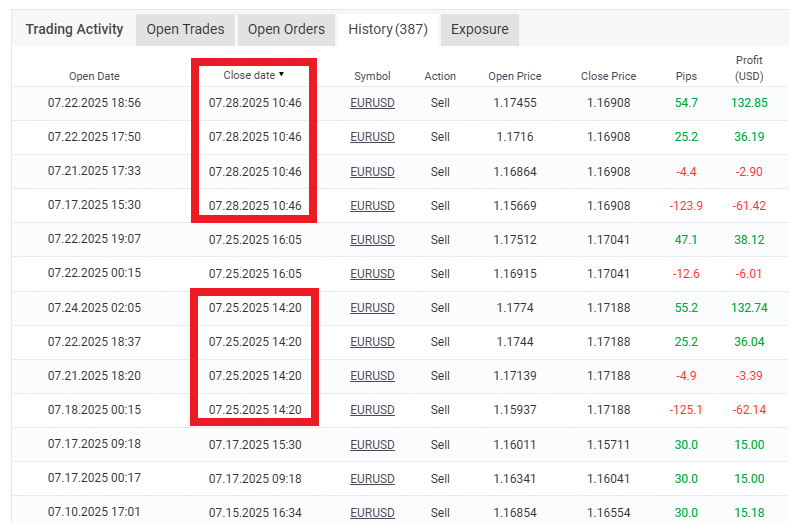
The first thing that stands out is that multiple positions are often closed together at exactly the same time. For example, you see several trades with the same close date and time, combining large losing positions with several smaller winning positions that offset them. This is the pattern typically seen in grid & martingale EAs: positions are added step by step as price moves against them, and when price finally retraces, the entire grid is closed at once.
Another important point is that lot sizes are hidden on Myfxbook. Judging from the movement of pips and profit, later positions in a sequence are likely opened with larger lot sizes. This suggests behaviour similar to a classic martingale, where the lot size is increased after losses to lower the average entry price. The fact that lot information is concealed may indicate that the developer prefers not to highlight this martingale-like aspect.
What the Margin Curve Reveals About Temporary Stress
Looking at the Myfxbook margin chart, you can see repeated sharp downward spikes.

The margin line on Myfxbook shows how much free margin remains relative to the current open positions. Steep drops in the graph mean that available equity has been rapidly squeezed, in other words, periods where floating losses have ballooned.
In this account, after layering grid positions, strong one-directional moves cause the margin to be heavily compressed. When price later reverses, the entire grid is closed and the margin jumps back to previous levels. This cycle repeats multiple times. It is a typical risk profile of grid EAs where “the balance grows steadily most of the time, but the account occasionally comes under severe stress.”
Gap Between the Vendor’s Large Balance and Ordinary Users
The vendor’s account balance has already grown to around $9,000. In grid & martingale strategies, the likelihood of ruin depends heavily on the balance-to-lot-size ratio. With a sufficiently large balance, the account can withstand a certain amount of adverse movement. But if you try to copy the same risk settings on a small account, the probability of blowing up the account with a single strong trend rises sharply.
It is also quite possible that the vendor is running many different grid & martingale strategies in parallel and only publishing the accounts that happen to have survived on Myfxbook. If you forward test enough such systems, it is natural that a few will show “large growth without having blown up yet,” and FX Proctor EURUSD Path1 is likely one of those surviving examples.
Therefore, while the forward results as of December 24, 2025 look extremely impressive, there is a strong possibility that what we are seeing is simply “a grid & martingale account that has happened to survive up to now.” There is no guarantee that performance will continue in the same way going forward, and if you use similar risk settings on a small account, you must always be aware of the worst-case scenario of losing the entire balance.
Trading Logic and Risk Characteristics
Core Concept as Described by the Vendor
The developer describes FX Proctor as “an intelligent automated trading system that reads overall market direction on the daily timeframe and flexibly adjusts positions.” According to the official concept, it checks the market trend on D1, then automatically adjusts take-profit, stop-loss, and grid distances based on market conditions to control drawdown while steadily building profit.
In practice, however, when you examine the forward history and trade placement on the charts, it becomes clear that the EA’s core is a grid & martingale strategy. Profit is generated by increasing lot size and layering positions. With this type of system, you must always assume that “it’s easy to make steady profits most of the time, but the risk of blowing up the account in a single event is high.”
“Counter-Trend Entries” Visible on the Daily Chart
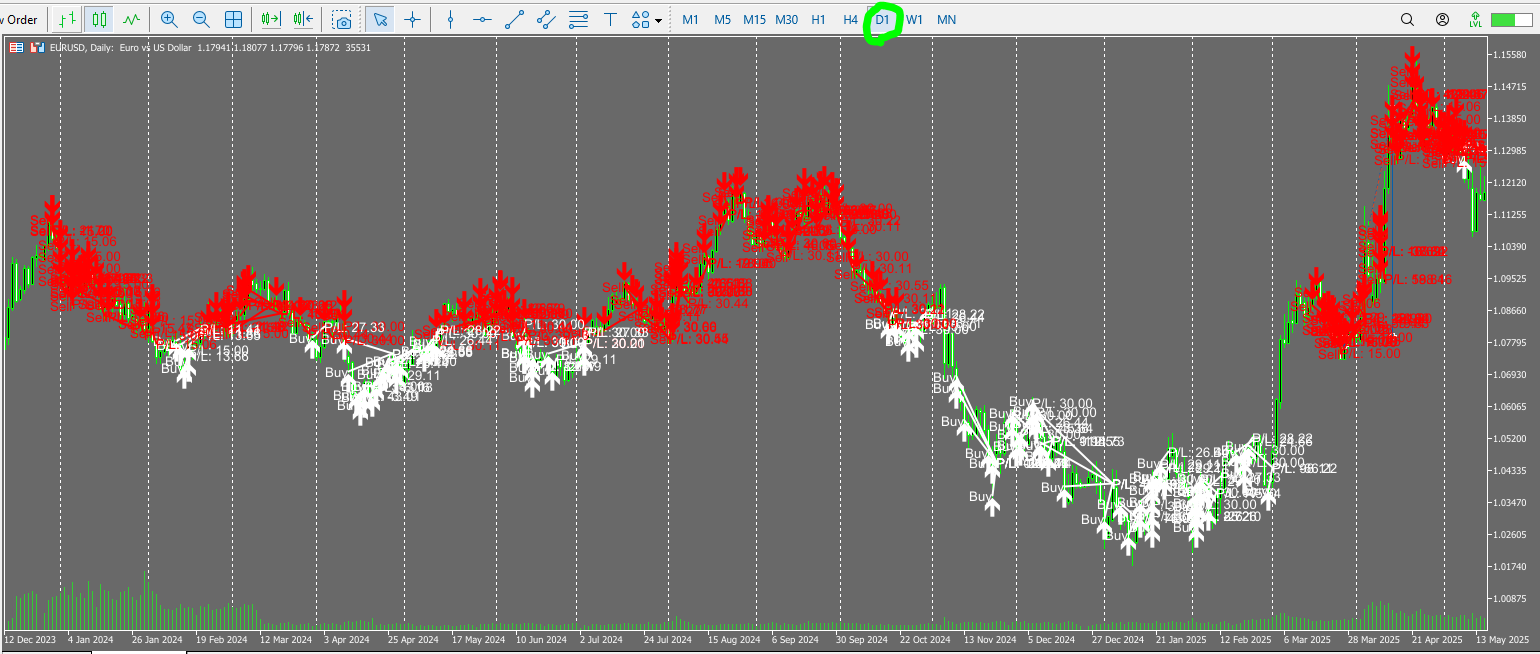
When the forward trades are plotted on the daily (D1) chart, white arrows mark buy positions and red arrows mark sell positions. Viewed as a whole, you can see multiple layers of sell grids during clear uptrends, and conversely, buy grids stacked during downtrends.
Rather than “entering in the direction of the trend after checking the daily trend,” as the developer claims, the behaviour looks more like a classic counter-trend grid strategy that keeps adding positions against the major daily trend and aims to close them all together on a retracement. While the trend continues smoothly, positions keep piling up, placing increasing pressure on equity and margin.
Multi-Layer Grid & Martingale on the H1 Chart
When you zoom into the H1 timeframe, the EA’s behaviour becomes even clearer.
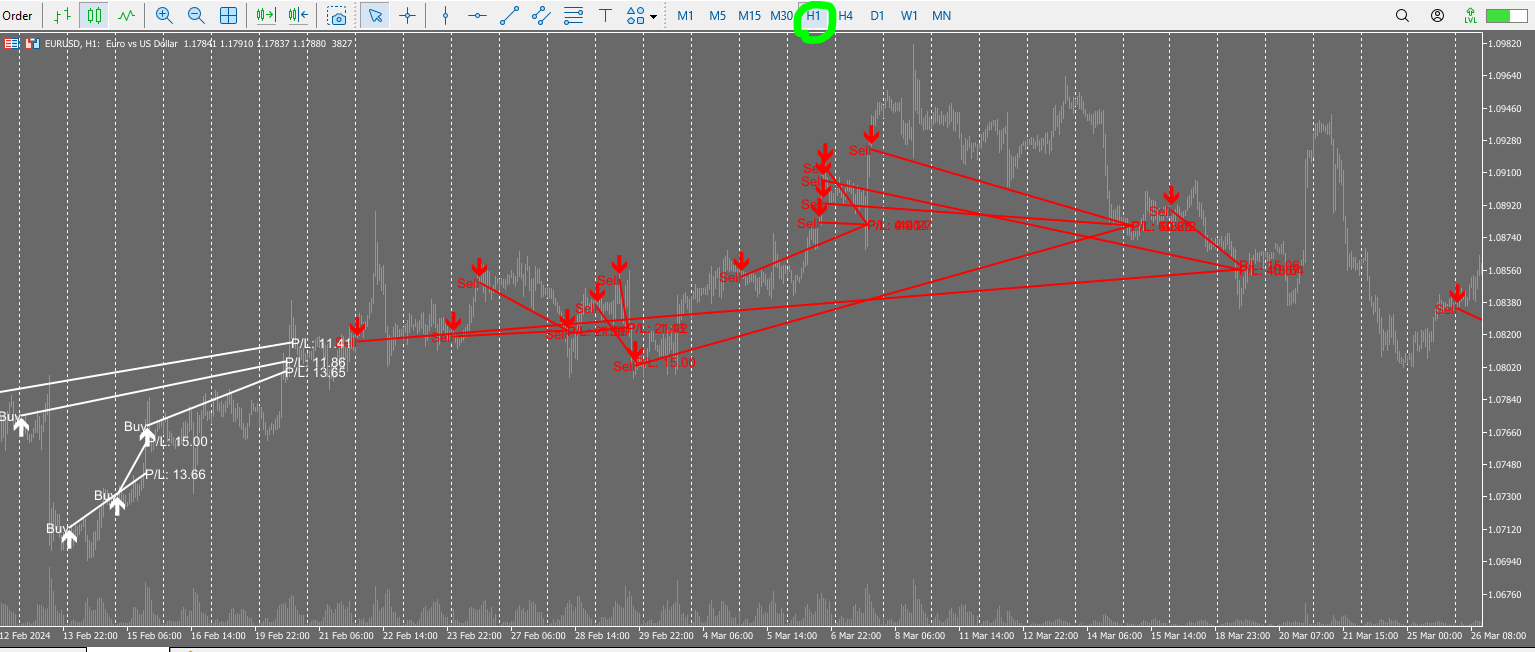
In a down-move, the EA starts with a small initial sell position and then adds new sell positions step by step every time price moves against it. When the market eventually reverses, it closes all accumulated positions at the same time, locking in an overall profit.
Judging from the pattern of pips and profit in the trade history, later positions in the sequence are likely opened with larger lot sizes. Although Myfxbook hides the lot information, the behaviour strongly suggests martingale-style position sizing that increases lot size while layering the grid to lower the average entry price.
In other segments, you can see buy grids and sell grids overlapping over the same period, indicating that multiple grid logics are running in parallel. Stacking positions in this multi-layered way can boost profitability when it works, but it also means that losses escalate very quickly when floating losses become concentrated in one direction.
Risks Implied by the Logic and the Worst-Case Scenario
As we have seen, FX Proctor’s actual behaviour is that of a high-risk strategy based on grid & martingale. As long as the market remains within a certain range and keeps swinging back, the EA can generate high returns by building grids and closing them out in profit.
However, when a strong one-way trend persists, both the number of positions and the total lot size keep increasing, causing floating losses on the entire account to explode. Especially if the lot size is set too high relative to the account balance, you must remember that a single strong trend can be enough to completely wipe out the account.
The forward results alone look very attractive, but behind them lies a risk profile where “in exchange for high returns, there is always the possibility of the balance going to zero.” If you consider using this EA, you must first understand the inherent blow-up risk of grid & martingale strategies and combine it with your own safeguards such as trading only with risk capital, using small lot sizes, and setting strict withdrawal rules.
Overall Evaluation and Conclusion (as of December 24, 2025)
FX Proctor EURUSD Path1 looks extremely attractive if you focus only on its forward performance, but beneath the surface it always carries the grid & martingale-specific risk of “losing the entire account in one hit.” Based on the analysis so far, the key points are as follows.
Key Evaluation Points for FX Proctor EURUSD Path1
- Roughly two years of forward testing have produced a very high total gain of +799%, making it top-tier in terms of raw performance numbers.
- It operates on the daily timeframe, so it is less dependent on ultra-tight spreads and execution quality than scalpers and is relatively easy to run on typical brokers.
- In reality, the trade history shows a classic grid & martingale strategy, which can drive the account into severe stress if a long-lasting trend develops.
- Lot sizes are hidden on Myfxbook, but the trade history suggests that lots are increased while new positions are added.
- The margin chart shows repeated sharp spikes, indicating that large floating losses are being carried while maintaining the grid.
- The vendor’s balance has already grown significantly, and it is quite possible that only “surviving accounts” are being selectively published.
Who This EA Is (and Isn’t) For
- Traders with a high risk tolerance who are willing to accept the worst-case scenario of a total account loss in exchange for the possibility of very high returns.
- Users trading with surplus funds who can keep lot sizes as small as possible and treat this as just one high-risk component in a broader portfolio.
- Experienced traders who fully understand the characteristics and risks of grid & martingale EAs and who can define and follow their own withdrawal and risk-management rules.
Points Cautious Investors Should Keep in Mind
- This is not a conservative EA for stable growth; it can easily become a classic “steady gains for a while, then one big crash” type of system.
- Copying the vendor’s risk settings on a small-balance account will bring you much closer to ruin than on the vendor’s large account.
- Even though the past two years of forward results are excellent, there is no guarantee that the same market conditions will continue, and it is dangerous to treat the historical performance as the expected value for the future.
In short, FX Proctor EURUSD Path1 is an EA that offers high returns in exchange for shouldering the risk of blowing up the account. While the forward performance as of December 24, 2025 is impressive, its grid & martingale nature means that whether or not you should run it depends entirely on your risk tolerance and capital plan, and the decision must be made with great care.
In reality this is a high-risk strategy that combines grid and martingale. The current maximum drawdown is contained around 33%, but if a one-way trend continues, there is a real possibility of blowing up the account in a single move. This EA is not designed for stable, conservative trading – you need to treat it as a “high-risk EA where a total account loss is always on the table.”