EA Overview
| Logic Overview | Breakout |
|---|---|
| Martingale | No |
| Grid | No |
| Scalping | No |
| Timeframes | 15M |
| Developer | Profalgo Limited(Wim Schrynemakers) |

Forward Test Analysis (as of December 16, 2025)

This section summarizes the forward performance currently available as of December 16, 2025, based on the MQL5 signal statistics screen.
With only about 12 weeks of forward history, it is still too early to make a definitive judgment about long-term edge.
Current Performance Snapshot
- Operating period: 12 weeks
- Growth: 18%
- Profit: +81.37 USD
- Total trades: 266 (about 37 per week)
- Average holding time: 3 hours
Risk–Reward (Quality of P/L)
- Win rate: 40.22% (more losing trades than winning trades)
- Profit Factor: 1.07
- Average win: +11.22 USD / Average loss: -7.04 USD
- Best trade: +41.24 USD / Worst trade: -32.51 USD
The win rate is not high, but the average win exceeds the average loss, suggesting a payoff structure leaning toward “small losses, larger wins.”
For this style, the key is not perfect entries but whether the strategy can capture larger moves when conditions align.
However, with a relatively low Profit Factor of 1.07, the edge is not yet strong enough to declare success—continued monitoring is required.
Use of High-Risk Techniques (Martingale / Grid)
The developer claims this EA avoids high-risk approaches such as martingale and grid systems.
The current profile—lower win rate with average win greater than average loss—also looks different from typical grid-style “high win rate” structures, which supports that claim.
Still, the safest approach is to confirm through backtests and trade logs (e.g., lot progression and whether positions are added) before making a final call.
Conclusion at This Stage (Forward Data Only)
At the moment, the EA shows a favorable risk–reward shape, but the forward record is too short to finalize an evaluation.
A more confident assessment requires at least several months (ideally 6+ months) of forward data, plus consistency checks against backtests that reflect spread and slippage.
Backtest Results Analysis (My Test)

This section summarizes my own MT5 Strategy Tester backtest results as of December 16, 2025.
A backtest is only a reproduction under specific historical conditions and does not guarantee future performance.
Backtest Settings (My Configuration)
- Period: 2020/01/01–2025/12/28
- Markets: SP500 / US30 / NASDAQ (USTEC) / DAX (DE40)
- Initial balance: 10,000 USD
- Lot size: Fixed 0.01 lot
- Other settings: Default
- Spread: Variable
Profitability Highlights (Risk–Reward View)
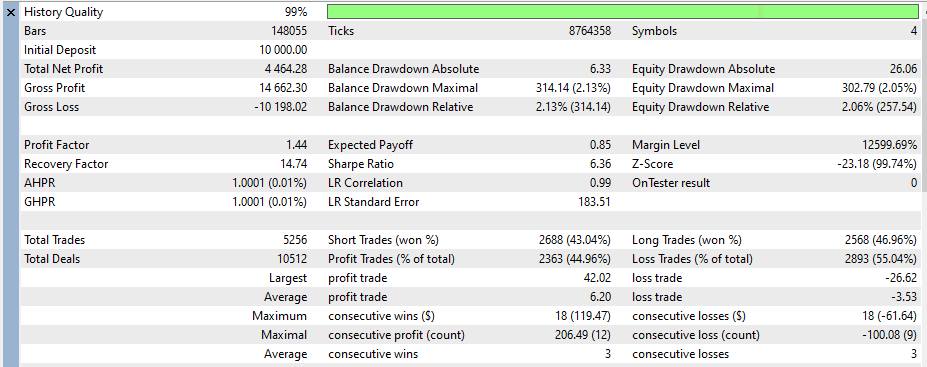
- Total Net Profit: +4,464.28 USD
- Profit Factor: 1.44
- Expected Payoff: 0.85 USD
- Largest profit trade: +42.02 USD / Largest loss trade: -26.62 USD
- Average win: +6.20 USD / Average loss: -3.53 USD
The key takeaway is that this is not a “win-rate-driven” EA. It appears designed to accumulate returns through payoff balance (average win greater than average loss).
Even with straightforward conditions—fixed 0.01 lot and default settings—the net profit increased steadily, indicating a favorable risk–reward profile in the backtest.
Drawdown Assessment (Absolute Values, Not %)
- Lot size: Fixed 0.01 lot (this test)
- Equity drawdown (Absolute): 26.06 USD
- Equity drawdown (Maximal): 302.79 USD
Because drawdown percentages vary widely depending on balance and lot sizing, this review focuses on absolute drawdown.
Under fixed 0.01-lot operation, the maximal equity DD stayed around 302.79 USD.
Compared with total net profit (+4,464.28 USD), the “return per tolerated loss” looks efficient in this backtest.
Trade Count and Stability (Profitable Even With More Losers)
- Total trades: 5,256
- Winning trades: 2,363 / Losing trades: 2,893
- Short vs. long: roughly balanced
Even with more losing trades than winning trades, the strategy finished with a positive net result.
This pattern fits a payoff-driven approach (“cut losses small and let winners run”) rather than dependence on risky recovery methods like grid or martingale.
For a final determination, it’s still best to confirm details such as lot progression, position stacking, and holding-time behavior.
Conclusion at This Stage (Strong, but Stay Cautious)
The backtest shows good return and risk–reward characteristics, and the strategy foundation looks promising.
However, this test is limited to the post-2020 period, and results may change with market regime shifts (volatility, sharp index moves, spread expansion, execution quality).
Instead of rushing to conclusions, it is more reasonable to keep updating the evaluation as forward data accumulates.
Trading Logic and Risk Characteristics
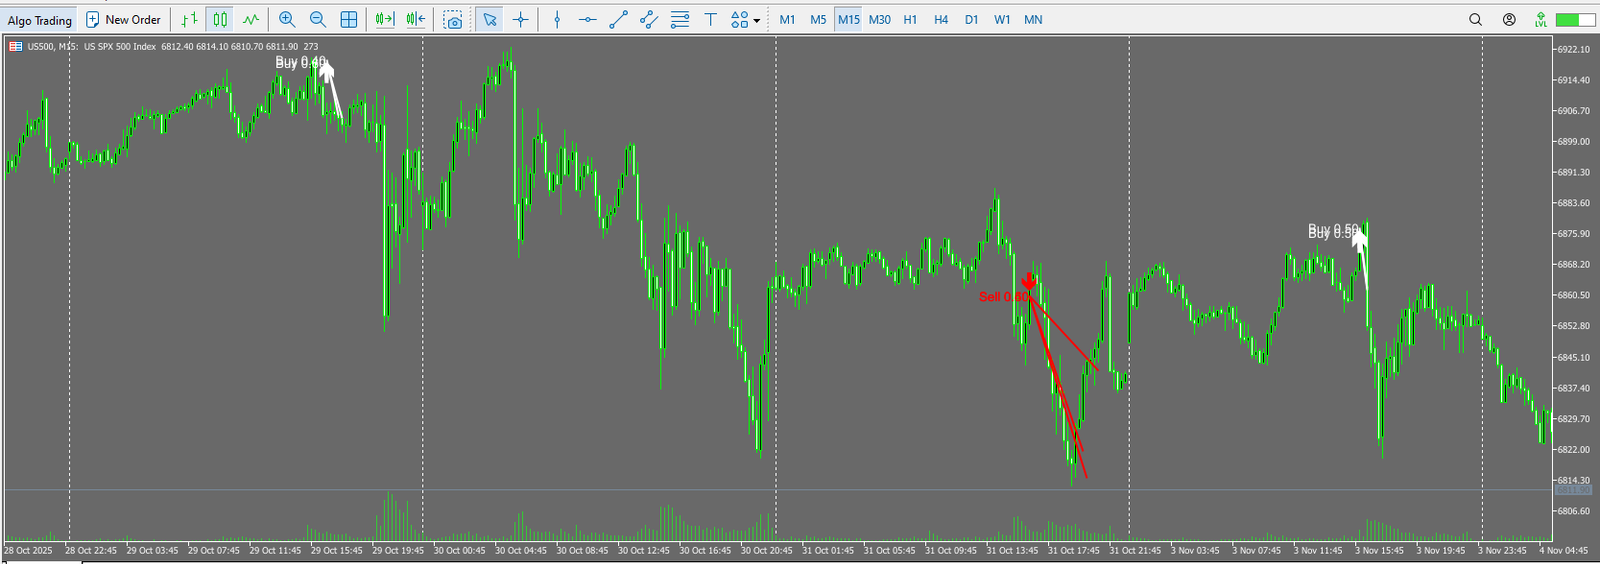
In this section, I organize the developer’s explanations (i.e., what the developer claims), and also summarize risk characteristics inferred from the forward trade-history charts (white = Buy, red = Sell).

Strategy Overview (Developer’s Description, Summarized)
The ORB Master is an MT5 EA built around an Opening Range Breakout (ORB) approach for equity indices (SP500 / US30 / NASDAQ / DAX).
According to the developer, it aims to capture momentum when price breaks above or below the initial range formed shortly after the U.S. and European market opens.
Another stated feature is diversification: multiple strategy variants per index, intended to reduce correlation when run as a portfolio.
How Entries and Exits Are Structured
ORB strategies can capture strong directional moves, but they are also prone to false breakouts.
As a result, this EA tends to rely less on high win rate and more on payoff balance—keeping losses small while aiming for larger wins when conditions align.
This structure can deliver strong risk–reward efficiency when the breakout follows through.
Risk Management (No High-Risk Systems, More Safety Filters)
- No use of high-risk systems like grid or martingale (developer claim)
- Filters to avoid unfavorable conditions (e.g., maximum spread limits)
- Prop-style controls such as pausing trading / closing positions after reaching daily drawdown limits (developer claim)
- News filters intended to avoid major events (NFP, CPI, rate decisions, etc.; developer claim)
- Randomization in entry/exit timing to avoid identical “crowded” execution patterns (developer claim)
Overall, the design appears focused on durability: instead of forcing a high win rate, it adds layers of protection against spreads, news shocks, and sudden moves.
This stability-oriented approach is a strong positive point.
What the Trade-History Charts Suggest (White=Buy, Red=Sell)
In the attached forward trade-history charts, white arrows indicate buys and red arrows indicate sells.
For ORB systems, profitability often comes from “bigger winners and smaller losers.”
On charts, this typically shows up as capturing meaningful moves when a trend follows through, while cutting or limiting damage when price reverses.
Key Caution (Indices + Market Open = Execution Sensitivity)
ORB trades are heavily affected by volatility and spread widening around the market open.
That is why strong backtests do not always translate cleanly into forward performance.
Index CFDs also vary widely by broker—symbol specs, trading hours, spreads, and execution quality—so it’s essential to confirm that your symbol setup and operating conditions match the intended environment.
Overall Verdict / Summary
This review is based on the forward results currently available, my own backtest, and the developer’s description, as of December 16, 2025.
Because the forward history is still short, I avoid overconfidence and focus on clear strengths and what must be monitored next.
Strengths
- Good risk–reward profile: built around payoff balance (small losses, larger wins) rather than win-rate dependency.
- Not reliant on high-risk tactics: the developer states no grid/martingale, and the performance shape appears consistent with that.
- Stability-oriented logic: spread limits, news filters, and daily DD controls emphasize protection (per developer description).
- Diversification concept: multiple indices and strategy variants aim to reduce correlation.
Risks / Limitations
- Short forward record: not enough data yet to confirm long-term reliability.
- Execution sensitivity: ORB around the open is vulnerable to spread widening and slippage.
- Setup complexity: symbol/session differences and preset settings can affect results.
Conclusion (As of Now)
- The risk–reward shape looks promising in both backtest and forward, and the strategy direction is a positive.
- However, with limited forward history, it is too early to declare a proven edge.
- The most reasonable approach is to keep monitoring forward performance for several more months while watching drawdown behavior and execution impacts.
Who This EA May Suit / Not Suit
- May suit: traders who understand index ORB behavior (open-hour volatility, spreads, slippage) and can validate with low lots first.
- May not suit: traders who want to scale up immediately based on short-term forward results alone.
The developer explicitly states this EA uses no grid or martingale. In my backtest, it kept a favorable risk–reward profile, with maximum equity drawdown contained to about 302.79 USD. That said, because ORB trades around the market open, slippage and spread widening remain key risks.