EA Overview
| Logic Overview | Mean Reversion |
|---|---|
| Martingale | Yes |
| Grid | Yes |
| Scalping | No |
| Timeframes | 5M |
| Developer | Bogdan Ion Puscasu |

[Video Guide] Quantum King EA: Verification & Risk Analysis
This article is also available in a detailed video format. It provides a visual summary of the MT5 live behavior and risk dynamics—insights that are often difficult to grasp from data alone.
[Video Overview]
- Forward Analysis: Real-world trading performance and latest results.
- Backtest Analysis: Evaluating resilience against historical market data.
- Risk Profile: Essential precautions to know before you start trading.
Forward Test Analysis (as of December 2025)
+122% in 15 Weeks – Impressive at First Glance
In the forward test currently available at the time of writing (early December 2025), Quantum King EA shows a growth of about +122% over roughly 15 weeks. On a monthly basis, this equates to around +27%, which is a striking performance in pure numerical terms.
The maximum drawdown is also limited to 15.2%, so at first glance the statistics suggest “very good returns for the level of risk.”
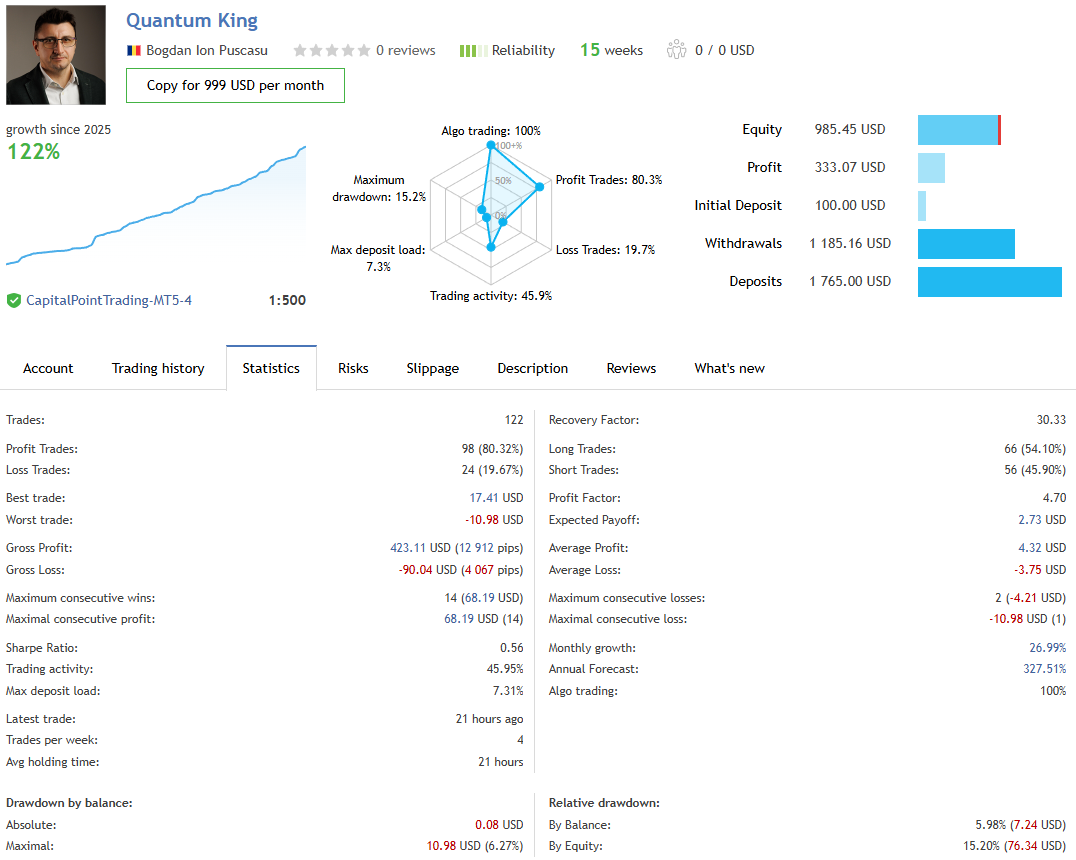
There have been 122 trades so far, around 80% of which were winners, and the profit factor is 4.70.
For a short forward period, this is an exceptionally smooth equity curve.
However, it is important to remember that this is only the result for a “limited period in 2025”, and it is dangerous to judge long-term safety based on these numbers alone.
Why Grid + Martingale Naturally Produces Short-Term Uptrends
As discussed later, Quantum King EA uses a simple strategy that combines grid (averaging down) and martingale.
Every time the price moves against the initial position, it adds new orders and increases the lot size to pull the average entry price closer to the current market.
As long as the market remains roughly range-bound, the EA often ends up closing the entire basket in profit,
even after temporarily carrying floating losses.
As a result, over just a few months from the start of the forward test,
it tends to produce a very smooth upward-sloping equity curve, as we see here.
In other words, the current forward results merely show that “over these few months, AUDCAD’s price action happened to favor a grid + martingale strategy.”
They do not mean that the underlying logic itself is low risk.
The Hidden “One-Shot Blow-Up” Risk Behind a 15.2% Max Drawdown
The current forward test shows a maximum drawdown of 15.2%, which looks relatively modest.
However, because the EA uses grid and martingale, we should assume that the underlying risk is quite high.
If a strong trend persists and floating-loss positions keep stacking up,
the added positions grow in size like a snowball.
Once a certain tipping point is reached, there is a genuine possibility that a single move could wipe out the account (or at least most of it).
In this forward period, there simply happened to be no major, sustained trend,
and every grid cycle eventually “came back” enough to close in profit, which kept drawdowns shallow.
There is no guarantee that the future will be equally forgiving.
This is especially true when trading with compounding: as the account grows and lot sizes increase,
the absolute loss from a single blow-up also grows dramatically.
Forward Results Need to Be Read Together with Deposits and Withdrawals
Looking at the screenshot, the initial deposit was $100, while subsequent deposits total $1,765 and withdrawals $1,185.
This means the current balance of $985.45 is “the result after multiple deposits and withdrawals”,
and should not be misread as “$100 has grown tenfold.”
In grid + martingale systems, the equity curve and final balance over a short forward period
are heavily influenced by the market environment and the timing of deposits and withdrawals.
The current numbers should therefore be treated as reference only.
You should always evaluate them together with long-term backtests
and a longer forward track record before drawing conclusions.
Backtest Analysis
A 20-Year Long-Run Test on AUDCAD
To better understand Quantum King EA’s risk profile, I ran my own backtest in my environment.
The test conditions were as follows:
- Period: 1 January 2005 – 28 November 2025 (about 20 years of data)
- Symbol: AUDCAD
- Initial deposit: 10,000 USD
- Lot size: fixed 0.01 lot (increasing via martingale)
- Other settings: left at default
- Spread: floating
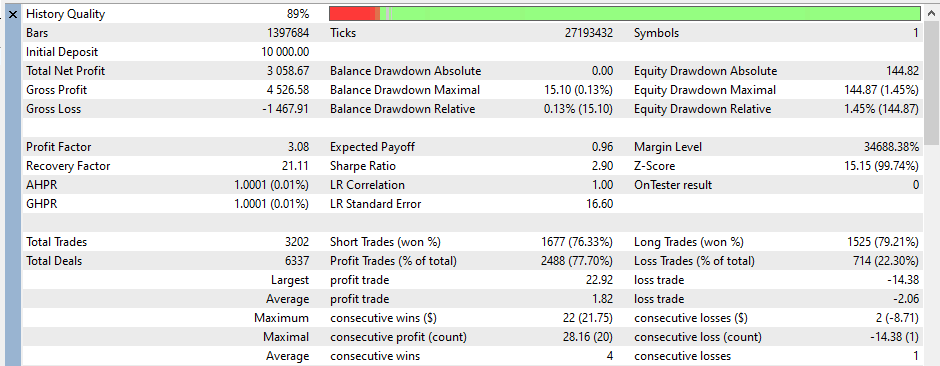
History quality was 89%. While not perfect, this is sufficient to judge long-term tendencies with reasonable confidence.
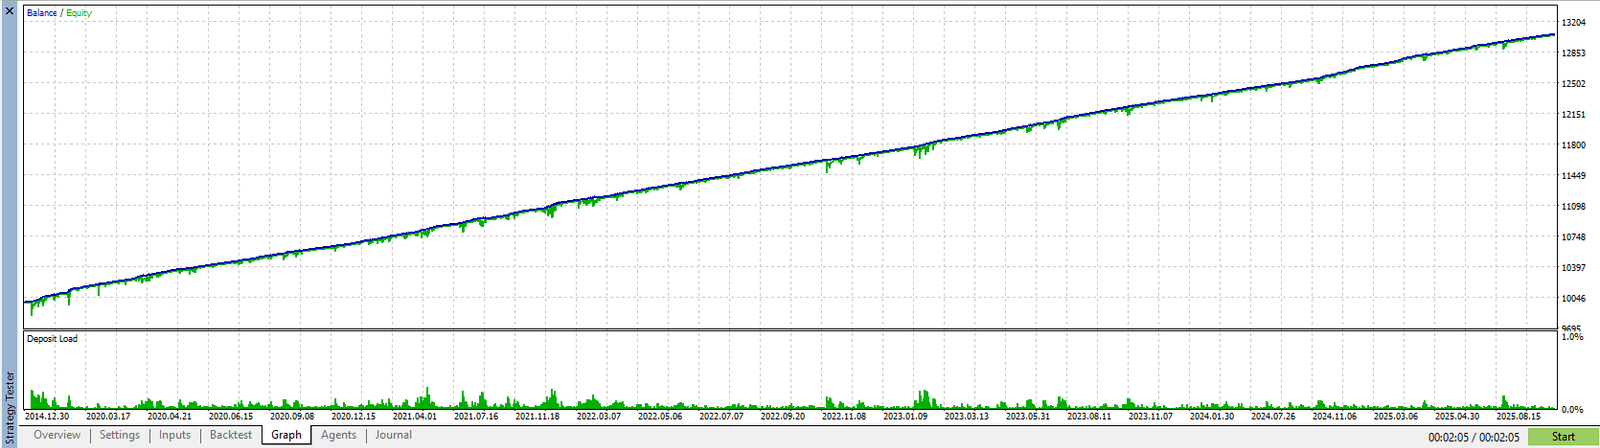
Balance Curve: Almost a Straight Upward Line
Looking at the balance graph, the curve from 2005 to 2025 is almost a straight, steady uptrend.
The equity line (floating P/L) closely overlaps the balance line,
and there are very few instances where floating losses expand and drag the line down sharply.
Deposit load at the bottom of the graph remains low throughout,
which means that in this backtest, the martingale component put only modest pressure on the account.
Total net profit over 20 years was about $3,058,
which, relative to the initial balance of $10,000,
puts this EA firmly in the category of “slow but steady growth.”
It does not have the explosive power to multiply the account several times over in a short period,
but with small lots the fluctuations in the graph are very mild.
Maximum Floating Loss of About $145 – Evaluating Risk in Lots and Dollars
In this backtest, the maximum equity drawdown (largest floating loss) was about $144.87.
The EA starts at 0.01 lots and increases via martingale,
yet under these conditions the floating loss never expanded beyond roughly $150.
Evaluating drawdown as a percentage of balance can be misleading,
so here we focus on lot size and the absolute dollar value of floating losses.
A maximum floating loss of about $145 with 0.01 lots suggests that
grid spacing and lot increments are relatively conservative.
If you run the same logic with 0.1 or 1.0 lot as the starting size,
the maximum floating loss scales up accordingly, easily reaching hundreds or thousands of dollars.
The reason the backtest “looks safe” here is simply that
the starting lot size has been set very low.
3,200 Trades with About 78% Win Rate – A Classic “Slow and Steady” Profile
There were 3,202 trades in total, of which 2,488 were winners,
for a win rate of roughly 77–78%.
The profit factor was 3.08 and the recovery factor 21.11,
which are strong numbers for a steady-earning EA.
On a per-trade basis, average profit was about $1.82 and average loss about $2.06,
so each trade is relatively small.
However, the largest losing trade was -$14.38,
larger than a normal single-stop loss.
This likely reflects situations where multiple positions were built up via grid + martingale
and then closed together at a loss.
The “Front Side” and “Back Side” of the Backtest
With this configuration, the 20-year backtest showed a maximum floating loss of only about $145,
and the balance curve was very smooth.
On these numbers alone, the EA might look “low risk and almost safe to use.”
However, the true nature of Quantum King EA is still that of a simple strategy combining grid (averaging down) and martingale.
In this test, the starting lot of 0.01 kept martingale increments and the absolute size of floating losses small.
If you doubled or quintupled the lot size,
the same kind of price action could easily produce floating losses in the hundreds or thousands of dollars.
In other words, this backtest only shows that
“with default settings and very small lots, there were no major crises in the last 20 years of data.”
The structural risk has not changed, and if you misjudge the lot size,
the EA still carries the potential to blow up the account in a single event.
This must be kept firmly in mind, just as with the forward test.
Trading Logic and Risk Characteristics
Basic Concept: A Simple Grid + Martingale Structure
As the developer explains, Quantum King EA uses a very simple logic that combines grid (averaging down) and martingale.
It is dedicated to AUDCAD and builds positions at fixed intervals,
shifting the average entry price while waiting for the market to revert and then closing the basket in profit.
This is essentially a “cost-averaging” strategy.
According to the developer, grid spacing and lot increases are adjusted based on volatility using an “adaptive grid”.
The EA is not a trend follower; instead, it is designed to repeatedly capture pullbacks in ranging or zigzag markets.
In the current forward test, we can see this concept in action as the EA frequently opens and closes small trades,
steadily stacking up profits.
Initial Entries Are Purely Counter-Trend
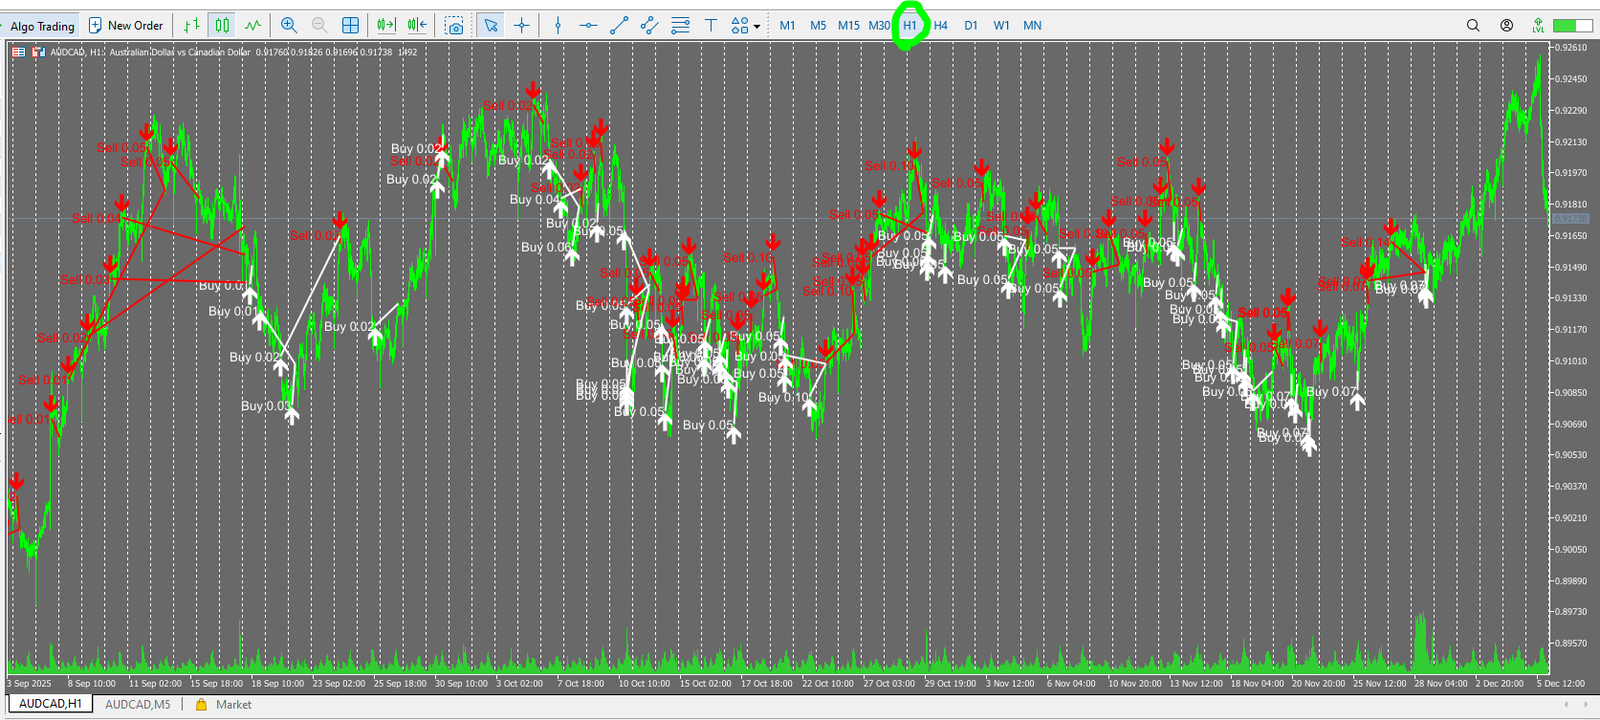
Plotting the forward trades on an H1 chart makes it clear that
the initial entries are almost always counter-trend.
In rising phases, the first order is a sell; in falling phases, the first order is a buy.
The design assumes that “after a strong move in one direction, there will be at least a partial pullback.”
If the market continues to move against that initial entry,
the EA adds new orders at each grid interval,
gradually increasing the lot size and bringing the average entry price closer to the current market.
On the chart, the white arrows (buys) and red arrows (sells) line up in steps and triangles,
clearly showing the behavior of a classic averaging + martingale system.

Money Management that Dilutes Losses Over Time
The core idea of grid + martingale is
“even if the first trade goes against you, you add more positions and increase the lot size so that a smaller pullback is enough to escape.”
Quantum King EA follows this classic pattern:
when the combined profit of the entire basket turns positive, it closes all positions and starts a new grid.
Because of this, the chart often shows temporary floating losses,
but in many short-term cases it appears as if “everything eventually closes in profit.”
In the backtest with a starting lot of 0.01,
there were few moments when floating losses sank deeply,
and the balance curve remained very smooth.
A Structure That Can Collapse in a Strong One-Way Trend
The downside is that this logic is extremely vulnerable to strong one-way trends.
Since the first entry is always counter-trend, as long as the trend continues,
the grid keeps expanding and the lot size keeps increasing.
If the market eventually turns, you can escape with relatively small losses,
but if it does not, the number of positions and the lot size balloon,
and the absolute size of floating losses can explode.
This structural risk becomes more apparent the more you increase the lot size.
In this test, the starting size of 0.01 lots kept the maximum floating loss within a few hundred dollars.
However, running the same logic with starting lots of 0.1 or 0.2
would easily produce floating losses in the thousands for the same price movement.
The result is that a single major trend can wipe out most of the account — or the entire account.
Short-Term Uptrend ≠ Long-Term Survival
As the developer claims, Quantum King EA can achieve very high win rates and smooth equity curves in range-like markets.
But behind that, it always carries the “one-shot blow-up risk” typical of grid and martingale systems.
If you simply increase the lot size or leave it running unattended for a long time
just because the short-term forward curve looks good,
there is a real risk that, when a major trend finally appears,
you will lose most of the profits in a single event.
In summary, Quantum King EA is “an EA that can draw a beautifully smooth uptrend in the short term,
but is structurally a high-risk, small-gains-big-loss system.”
When deciding whether to use it,
you should look beyond the backtest balance curve
and carefully consider the counter-trend entries, the grid + martingale behavior,
and how much floating loss you are truly willing to tolerate when increasing lot size.
Overall Evaluation and Summary
As an AUDCAD-only grid + martingale EA,
Quantum King EA belongs to the category of systems that look “very strong” in both forward and backtests.
However, behind the upward-sloping equity curve lies the familiar small-gains-big-loss risk structure.
Based on the analysis above, we can summarize its characteristics and key cautions as follows.
Strengths
- In the short forward test, it achieved about +122% over roughly 15 weeks with a very smooth equity curve.
- Under the backtest conditions used here (AUDCAD, about 20 years, fixed 0.01 lot), the balance curve is almost a straight uptrend.
- Maximum floating loss was only around $145, and with small lots there were no major crises visible in the historical data.
- There are many trades and a high win rate, so profits tend to accumulate steadily in the short term.
Points of Caution and Risks
- The logic is a simple grid + martingale, and the initial entry is essentially always counter-trend.
- If the market runs strongly in one direction, the number of positions and lot size increase, and the absolute size of floating losses can surge.
- Because the starting lot in our test was a very small 0.01 lot, drawdowns appear small; raising the lot size can easily turn the same price moves into “one-shot blow-up” events.
- The smooth forward uptrend mainly reflects a lucky combination of recent market conditions and lot settings, and does not guarantee long-term survival.
Who Is This EA For?
- Traders who understand how grid + martingale EAs work and accept the risk that a single event can heavily damage the account.
- Those who can keep the starting lot size very small and trade only with money they can afford to lose entirely.
- Intermediate to advanced users who can resist chasing the pretty equity curve, and instead manage lot sizing and risk by themselves.
Final Verdict
Overall, Quantum King EA can be described as “an EA that looks like an honor student when traded with conservative lots, but carries a latent risk of a single large loss if you raise the lot size or leave it running for too long.”
Its forward and backtest graphs are highly attractive, but the core logic is still grid + martingale.
If you decide to use it, you must think carefully about how defensively you set your lot size and capital,
and operate under the assumption that “a big hit may eventually come someday.”
In reality, this is a classic “small-gains, big-loss” EA that opens the first trade counter-trend and then follows price with a grid plus martingale. In the backtest with a 0.01-lot starting size, the maximum floating loss was only about $145, but if you increase the lot size, the same price moves can severely damage the account in a single blow.