EA Overview
| Logic Overview | Mean Reversion |
|---|---|
| Martingale | No |
| Grid | No |
| Scalping | No |
| Timeframes | 15M |
| Developer | Ihor Otkydach |

Forward Test Analysis (Live Account Performance)
About +40% in 11 Weeks – Still in the “Trial Period” Phase
Pips Hunter has been running for about 11 weeks on a PepperstoneUK live account. Starting from an initial balance of $2,982, the current equity is $3,802.61 with a total profit of $1,199.73, which works out to roughly +40% growth. The monthly growth rate is around +25%, which is quite high, and the forward equity curve is currently a clean upward slope. However, because the period is still less than three months, we cannot completely rule out the possibility that the EA has only experienced favorable market conditions so far.
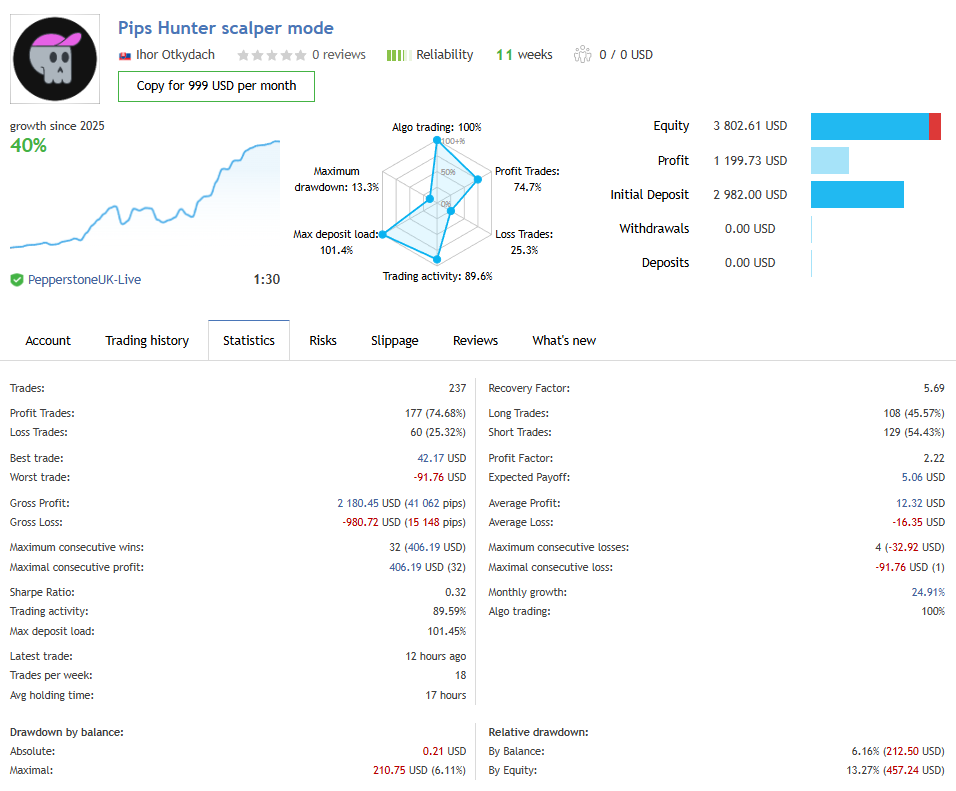 Forward results of running Pips Hunter on a PepperstoneUK live account for about 11 weeks. The record shows roughly +40% growth, a profit factor of 2.22, and a maximum drawdown of around 13%.
Balance of Trade Frequency, Win Rate, and Expectancy
In the forward test, 237 trades have been executed so far, with an average of about 18 trades per week. There have been 177 winning trades, giving a win rate of about 74.7%, and 60 losing trades (about 25.3%), which makes it a high-win-rate scalping–swing EA.
The average profit per trade is +$12.32 and the average loss is −$16.35, so the risk–reward profile is one where winners are slightly smaller and losers are larger. Even so, the profit factor is 2.22 and the expectancy is a little over +$5 per trade, figures that indicate a clear statistical edge at this stage.
Drawdown and Margin Load
In terms of drawdown, the maximum balance drawdown is about 6.1%, and the maximum equity drawdown is about 13.3%. Looking at the graph, instead of a single sharp drop that sinks the account, the equity tends to dip gradually during a string of losses and then recover during subsequent winning streaks.
On the other hand, the maximum deposit load (margin load) is 101.45%, meaning that at its peak the account was practically fully margined. When several positions overlap across multiple currency pairs, floating losses can easily expand, so if you push the lot size too aggressively, there is a real risk that “normal drawdowns look shallow, but a few unlucky sequences can still cut the balance significantly.”
Average Holding Time and Trading Style
The average holding time is about 17 hours, which, as advertised, makes this more of an intraday–swing style scalper than an ultra-short-term scalper. Positions are often held over the New York and London sessions, and the EA does not enter and exit dozens of times within a very short period.
Because of this, spreads and execution quality are important, but so are broker conditions such as nighttime spread widening and rollover, which can significantly affect performance.
Profit Concentration by Currency Pair
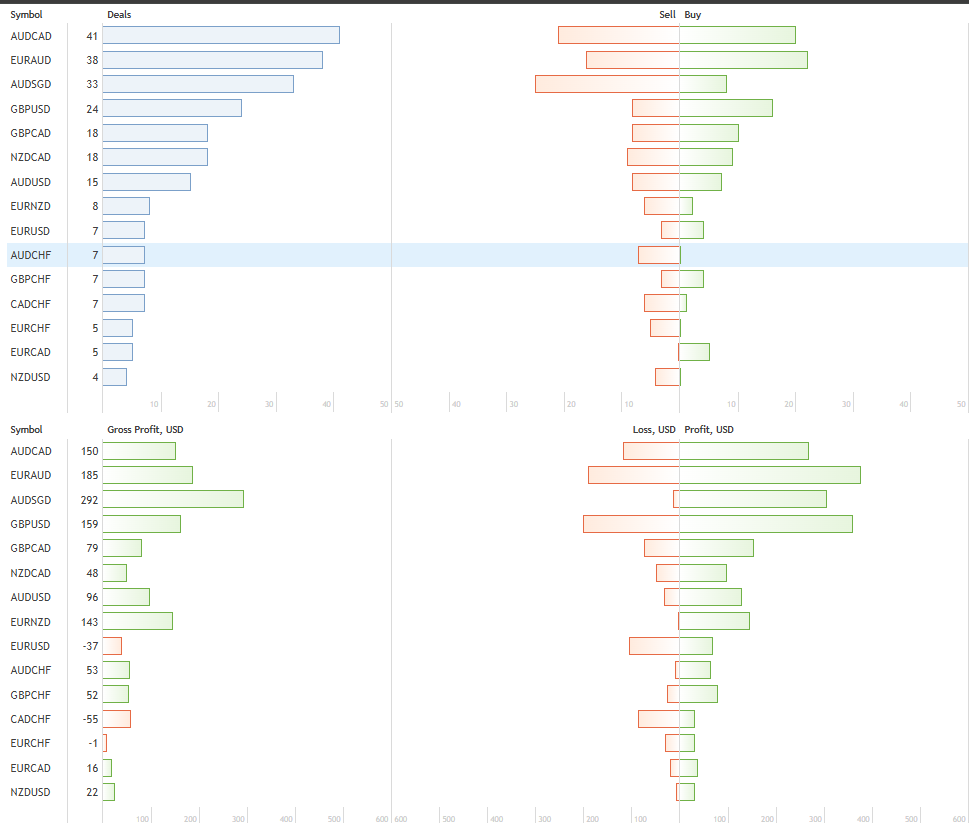 Looking at trade count and profit by currency pair, cross pairs such as AUDCAD, EURAUD, and AUDSGD are the main profit drivers, while some pairs are slightly loss-making. There is room to optimize the portfolio by distinguishing strong performers from weak ones.
Looking at the distribution by symbol, the largest contributions in terms of both number of trades and profit come from cross pairs such as AUDCAD, EURAUD, AUDSGD, GBPUSD, GBPCAD, and NZDCAD. All of these pairs are currently in the black and are driving the portfolio’s overall profitability.
Meanwhile, pairs such as EURUSD, CADCHF, and EURCHF, although traded less frequently, are slightly loss-making. This suggests that, rather than all pairs contributing evenly, some are clearly stronger while others are weaker. For long-term operation, it makes sense to check performance by currency pair regularly and consider removing underperforming pairs to improve the portfolio’s risk–return balance.
Current Assessment of the Forward Test
Based on the forward test alone, the initial impression is that this is “a high-win-rate EA with a strong profit factor and relatively controlled drawdowns,” implying a decent positive expectancy. However, because the live operation has only been running for a few months, it has not yet been tested through extreme volatility or full-blown risk-off markets, and that limitation cannot be ignored.
Overall, the most reasonable classification at this point is “high potential, but still a short-sample, promising candidate.” Before committing significant capital, it is more realistic to continue forward testing with small lot sizes or on an evaluation account for a while.
Backtest Analysis
Test Conditions and Assumptions
For Pips Hunter, I ran my own backtest in the MT5 Strategy Tester, focusing exclusively on AUDCAD, which has been the best-performing pair in the forward test. The conditions were as follows:
- Period: 1 January 2005 – 28 November 2025 (about 20 years of data)
- Currency pair: AUDCAD
- Initial deposit: 10,000 USD
- Lot size: fixed 0.01 lots
- Other settings: default
- Spread: 60 points
In other words, the goal was to see “what happens if we run the best forward-performing pair with a small fixed lot over a long period.”
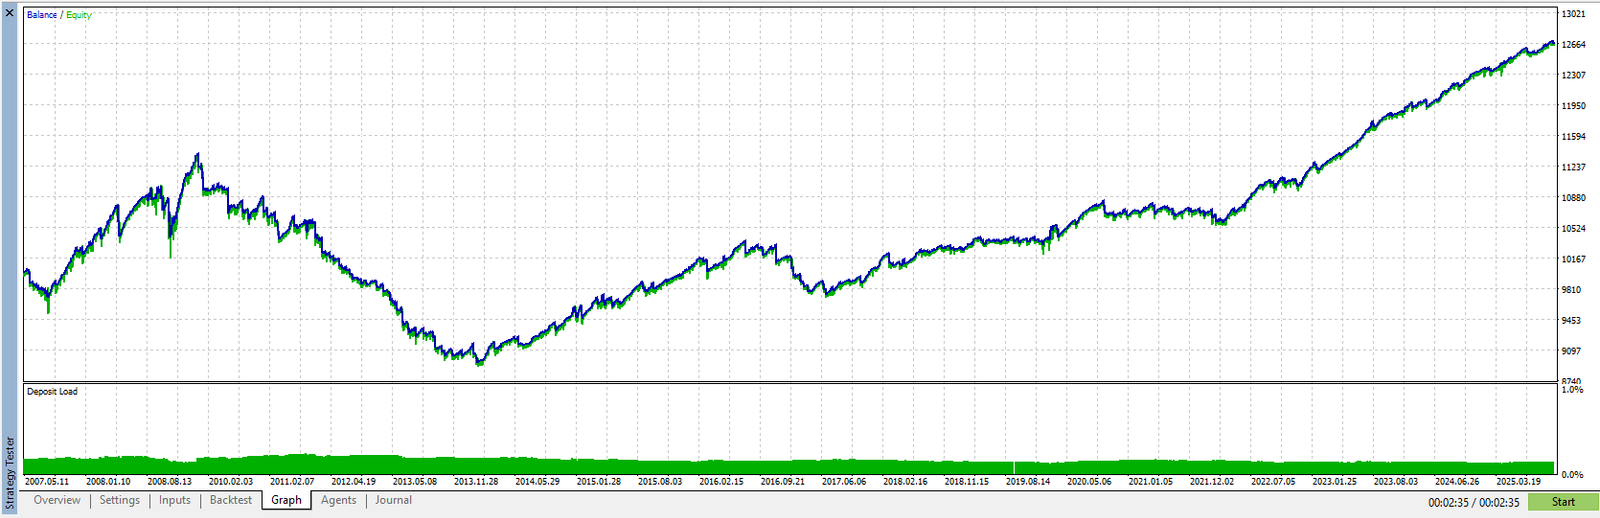 Twenty-year backtest result for AUDCAD alone, the pair that performs best in the forward test. There are deep drawdowns and long flat periods in the middle, and the final net profit is only about $2,700.
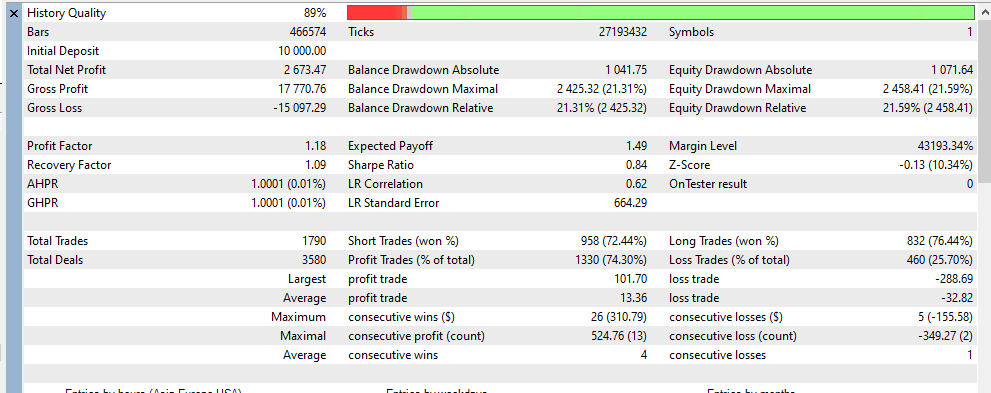 Despite the high win rate, the average loss is more than twice the average profit, and the profit factor is only 1.18. The poor risk–reward profile is clearly visible in the numbers.
Equity Curve: Deep Mid-Period Drawdown, Then an Uptrend
Looking at the equity curve, there is a long period of decline and stagnation from the early to mid part of the test (roughly from after the Lehman shock to around 2014). The balance is heavily reduced for a time, then slowly recovers, and from 2020 onward it shifts into a relatively smooth upward trend.
In the end, the total net profit is +$2,673.47 on an initial balance of $10,000, meaning it takes about 20 years of trading to reach that level of growth. This is a stark contrast to the forward results showing +40% in a short period, and it reveals the long-term stress contained in the strategy.
Trade Statistics: High Win Rate, Poor Risk–Reward
Over the entire backtest, there were 1,790 trades (3,580 deals). Of these, 1,330 trades were winners, giving a win rate of about 74%, and 460 trades were losers, so just like the forward test this is a high-win-rate EA.
- Gross profit: $17,770.76
- Gross loss: −$15,097.29
- Profit factor: 1.18
- Average profit per trade: +$13.36
- Average loss per trade: −$32.82
- Maximum profit trade: +$101.70
- Maximum loss trade: −$288.69
These numbers show that, although the win rate is high, the average loss is more than twice the average profit, and the maximum loss is about three times the maximum profit. With an overall profit factor of 1.18, the edge is quite modest; the profile is clearly “many small wins with occasional large losses,” reflecting the poor risk–reward characteristics.
Viewing Drawdown and Risk in Absolute Dollar Terms
In this backtest, drawdown is evaluated not in percentage terms but in absolute lot size and equity amounts.
- Maximum balance drawdown: about $2,425
- Maximum equity drawdown: about $2,458
- Maximum consecutive loss amount: −$349.27 (over 2 trades)
- Maximum single loss: −$288.69
- Maximum consecutive profit amount: +$524.76 (over 13 trades)
Because the lot size is fixed at a very small 0.01 lots, these amounts may look “acceptable” at first glance. However, if you scale up to 0.1 lots in live trading, the maximum drawdown would be roughly ten times larger, around $20,000, and at 0.2 lots it would approach $40,000. If you increase lot size based only on the strong forward results, you risk suffering large capital losses during the long equity valleys seen in the backtest.
Even the Best Forward Pair, AUDCAD, Only Reaches PF 1.18
The key point here is that even though this backtest uses AUDCAD, the pair that performs best in the forward test, the profit factor is only 1.18. In a multi-currency portfolio, if weaker pairs drag down performance, the overall PF could be even lower.
Over a 20-year horizon, the strategy experiences drawdowns of several thousand dollars and flat periods that last for years. If you focus only on the smooth upward forward curve over a few months, it is easy to overlook this long-term risk. It is important to think carefully about whether the risk–reward profile and severity of long-term drawdowns really match the “high win rate and smooth forward equity curve” that first attracts you.
Trading Logic and Risk Characteristics
Overview of the Logic as Described by the Developer
According to the developer, Pips Hunter is a hybrid EA that combines “intraday scalping and swing reversal” on the M15 timeframe only. It uses multiple indicators such as the Keltner Channel, Bollinger Bands, RSI, MACD, and Standard Deviation to detect short-term overextensions and volatility shifts, then enters on pullbacks and mean-reversion moves.
The developer also states that “no martingale or grid is used” and that “every position has a hard stop loss, with a dynamic stop-loss algorithm to reduce losses.” The EA is meant to be used as a multi-currency portfolio, and preset portfolios such as Katana, Knife, and Razor are provided.
 AUDCAD M15 chart showing the forward trade history of Pips Hunter. The chart visualizes mean-reversion entries into short-term overextensions and occasional stacking of multiple positions in the same direction.
Mean-Reversion Entries Visible on the Chart
When the forward trade history is plotted on the chart, the white arrows (buys) and red arrows (sells) clearly appear at short-term overbought and oversold zones. It sells near local peaks where the upmove pauses and buys after sharp drops during rebound phases. This behavior shows that the EA is not trend-following but primarily executes mean-reversion entries.
There are also sequences where several arrows in the same direction appear close together. This indicates that during sharp moves the EA enters multiple times with slightly different timing. It is not a dense grid-martingale system, but rather a mean-reversion EA that performs “step-in” buying on dips or selling on rallies.
No Grid Martingale, but Stops Are Slow
The backtest statistics and parameters show that, although Pips Hunter is marketed as “no averaging, no martingale,” the stop-loss distance is set quite wide. There are many situations where the average loss is more than double the average profit, so a single losing trade can wipe out several winners.
In other words, while lot size remains fixed and there is no grid-martingale scaling, the EA tends to hold onto mean-reversion entries while carrying floating losses, and final stop losses tend to be triggered late. When a strong trend persists, the long distance to the stop loss can cause equity drawdowns to temporarily swell.
Multiple Open Positions and Margin Risk
As the forward chart also shows, Pips Hunter sometimes holds multiple positions in the same currency pair at the same time. When price continues to move against those entries, new mean-reversion trades are added, increasing the number of positions while the existing ones remain in drawdown.
In the signal statistics, there are moments when the maximum deposit load exceeds 100%. Even though the portfolio is diversified across several pairs, at certain times the account can be almost fully margined. If lot sizes are set too aggressively, a few consecutive losses or an extended trend can put serious pressure on margin.
Summary of Logic and Risk Profile
Pips Hunter can be summarized as “a high-win-rate mean-reversion EA with slow stop losses and significant drawdown risk when multiple positions are open.” It does not use dangerous lot-increasing schemes like martingale or grid, but the combination of wide stops and multiple entries means that a single losing cycle can still result in larger-than-expected losses.
Therefore, when using this EA, it is essential to prioritize risk management in terms of how small you keep the lot size and how many currency pairs you run simultaneously, rather than focusing only on the high forward win rate.
Overall Evaluation and Conclusion
Where This EA Stands
- Pips Hunter is a mean-reversion scalping–swing EA operating on the M15 timeframe.
- It does not use martingale or grid; instead, it runs a fixed lot size across multiple currency pairs for diversification.
- The forward test shows a high win rate and a smooth upward equity curve, but the sample period is still only a few months.
Strengths Seen in the Forward Test
- The live forward curve is currently a straightforward upward trend.
- A win rate in the 70% range and a profit factor around 2 suggest a statistically meaningful edge.
- Key pairs such as AUDCAD, EURAUD, and AUDSGD are generating stable profits.
Risks Revealed by the Backtest and Logic
- As a mean-reversion EA, it tends to accumulate floating losses when trends persist.
- It is not a grid-martingale, but stop-loss distances are wide and losses tend to be cut late.
- It can hold multiple positions in the same direction, leading to temporary spikes in margin usage.
- Even for AUDCAD, the best forward-performing pair, the 20-year backtest shows only about a 1.18 profit factor, with long flat periods and drawdowns of several thousand dollars.
How It Should Be Used
- Rather than treating it as a main EA for your core account, it is safer to consider it a “promising candidate under evaluation.”
- Start with the smallest possible lot size and limit the number of currency pairs you run simultaneously.
- Be mindful of the differences between forward and backtest results—especially the depth of drawdowns—and monitor performance using a demo or small live account for an extended period.
- Review performance by currency pair regularly and adjust the portfolio, removing underperforming pairs where necessary.
Final Verdict
At this stage, my impression is that this is “a high-win-rate EA with solid potential, but one that inherently carries large mean-reversion stopouts and long-term drawdown risk.” The forward results over a few months are very attractive, but when we factor in the 20-year backtest, it is clear that jumping in with large capital without strict lot control and careful pair selection would be risky.
A more realistic approach is to continue forward testing with small position sizes and use that period to judge whether this EA truly fits your own risk tolerance before scaling up.
This is a mean-reversion EA that does not use martingale or grid, but the stop loss is wide and losses are cut late. It can hold multiple positions in the same direction, so when it gets caught in a strong trend, floating losses and equity drawdowns can temporarily become quite large.